


This image shows the perimeter of Rainbow Glacier in Glacier National Park: 1966, 1998, 2005, 2015.
What are some of the signs of climate change?
• Temperatures are rising world-wide due to greenhouse gases trapping more heat in the atmosphere.
• Droughts are becoming longer and more extreme around the world.
• Tropical storms becoming more severe due to warmer ocean water temperatures.
• As temperatures rise there is less snowpack in mountain ranges and polar areas and the snow melts faster.
• Overall, glaciers are melting at a faster rate.
• Sea ice in the Arctic Ocean around the North Pole is melting faster with the warmer temperatures.
• Permafrost is melting, releasing methane, a powerful greenhouse gas, into the atmosphere.
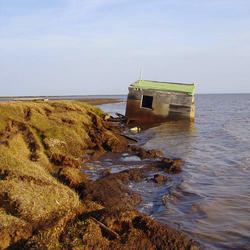
• Sea levels are rising, threatening coastal communities and estuarine ecosystems.
Related Content
Does an increase in the 100-year flood estimate originate from climate or land-use change?
Climate variability (dry cycles to wet cycles) and land-use change play a significant role, but there is a large amount of uncertainty around the flood quantile estimates (the value of discharge corresponding to the 100-year flood), particularly if there isn’t a long record of observed data at a stream location. Learn more: The 100-Year Flood The 100-Year Flood--It's All About Chance
What are the long-term effects of climate change?
Scientists have predicted that long-term effects of climate change will include a decrease in sea ice and an increase in permafrost thawing, an increase in heat waves and heavy precipitation, and decreased water resources in semi-arid regions. Below are some of the regional impacts of global change forecast by the Intergovernmental Panel on Climate Change: North America: Decreasing snowpack in the...
What is the difference between weather and climate change?
Weather refers to short term atmospheric conditions while climate is the weather of a specific region averaged over a long period of time. Climate change refers to long-term changes.
How can climate change affect natural disasters?
With increasing global surface temperatures the possibility of more droughts and increased intensity of storms will likely occur. As more water vapor is evaporated into the atmosphere it becomes fuel for more powerful storms to develop. More heat in the atmosphere and warmer ocean surface temperatures can lead to increased wind speeds in tropical storms. Rising sea levels expose higher locations...
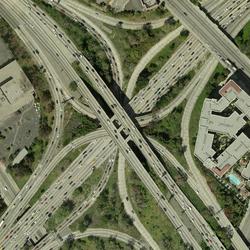
How do changes in climate and land use relate to one another?
The link between land use and the climate is complex. First, land cover--as shaped by land use practices--affects the global concentration of greenhouse gases. Second, while land use change is an important driver of climate change, a changing climate can lead to changes in land use and land cover. For example, farmers might shift from their customary crops to crops that will have higher economic...
How do we know the climate is changing?
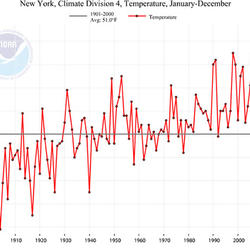
The scientific community is certain that the Earth's climate is changing because of the trends that we see in the instrumented climate record and the changes that have been observed in physical and biological systems. The instrumental record of climate change is derived from thousands of temperature and precipitation recording stations around the world. We have very high confidence in these...
What is the difference between global warming and climate change?
Although people tend to use these terms interchangeably, global warming is just one aspect of climate change. “Global warming” refers to the rise in global temperatures due mainly to the increasing concentrations of greenhouse gases in the atmosphere. “Climate change” refers to the increasing changes in the measures of climate over a long period of time – including precipitation, temperature, and...
Why is climate change happening and what are the causes?
There are many “natural” and “anthropogenic” (human-induced) factors that contribute to climate change. Climate change has always happened on Earth, which is clearly seen in the geological record; it is the rapid rate and the magnitude of climate change occurring now that is of great concern worldwide. Greenhouse gases in the atmosphere absorb heat radiation. Human activity has increased...
How do we know glaciers are shrinking?
Repeat photography and aerial / satellite photo analysis provide evidence of glacier loss in terms of shape and area. The USGS Benchmark Glacier project has collected mass balance data on a network of glaciers in Alaska, Washington, and Montana for decades, quantifying trends of mass loss at all sites. Extensive field data collection at these sites includes twice yearly visits to measure seasonal...
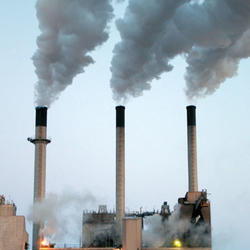
How does carbon get into the atmosphere?
Atmospheric carbon dioxide comes from two primary sources—natural and human activities. Natural sources of carbon dioxide include most animals, which exhale carbon dioxide as a waste product. Human activities that lead to carbon dioxide emissions come primarily from energy production, including burning coal, oil, or natural gas. Learn more: Sources of Greenhouse Gas Emissions (EPA)
How much carbon dioxide does the United States and the World emit each year from energy sources?
The U.S. Energy Information Administration estimates that in 2019, the United States emitted 5,130 million metric tons of energy-related carbon dioxide, while the global emissions of energy-related carbon dioxide totaled 33,621.5 million metric tons.
What is carbon sequestration?
Carbon dioxide is the most commonly produced greenhouse gas. Carbon sequestration is the process of capturing and storing atmospheric carbon dioxide. It is one method of reducing the amount of carbon dioxide in the atmosphere with the goal of reducing global climate change. The USGS is conducting assessments on two major types of carbon sequestration: geologic and biologic .

Rainbow Glacier perimeter: 1966, 1998, 2005, 2015.
This image shows the perimeter of Rainbow Glacier in Glacier National Park: 1966, 1998, 2005, 2015.

USGS Public Lecture: Warm Ice—Dynamics of Rapidly Changing Glaciers
- Glacier Numerology – The how big, how long, how thick, how much, how often, of glacier science.
- Glacier Photography – While a picture may be worth a thousand words, a collection of images may tell a complete forensic story.
- Glacier Numerology – The how big, how long, how thick, how much, how often, of glacier science.
- Glacier Photography – While a picture may be worth a thousand words, a collection of images may tell a complete forensic story.

Permafrost Study in the Yukon River Basin
Jay Hootch, former employee of Yupitt of Andreafski, drills to take winter chemistry samples to be used in a permafrost loss study in the Yukon River Basin.
Jay Hootch, former employee of Yupitt of Andreafski, drills to take winter chemistry samples to be used in a permafrost loss study in the Yukon River Basin.

Permafrost Study in the Yukon River Basin
Heading out to take water chemistry samples for a study on permafrost in the Yukon River Basin. The study examined the chemical and hydrological changes occurring in the basin due to permafrost loss.
Heading out to take water chemistry samples for a study on permafrost in the Yukon River Basin. The study examined the chemical and hydrological changes occurring in the basin due to permafrost loss.

Peeking into Permafrost
Barter Island sits at the top of the Arctic National Wildlife Refuge in Alaska, and with the Arctic facing quickly rising temperatures, USGS wants to investigate what’s causing the North Slope bluffs to erode so quickly.
Barter Island sits at the top of the Arctic National Wildlife Refuge in Alaska, and with the Arctic facing quickly rising temperatures, USGS wants to investigate what’s causing the North Slope bluffs to erode so quickly.

Allen Bondurant measuring the depth to permafrost along a thermokarst lake shore.
Allen Bondurant measuring the depth to permafrost along a thermokarst lake shore.
Allen Bondurant measuring the depth to permafrost along a thermokarst lake shore.

PubTalk 11/2012 — Understanding Climate-Wildlife Relationships
-- are American pikas harbingers of changing conditions?
by USGS Research Ecologist Erik Beever
-- are American pikas harbingers of changing conditions?
by USGS Research Ecologist Erik Beever

Drought Effect
The white colored rock (approximately 100ft high) shows the drop in the water level of Lake Mead as a result of the ongoing 10-year drought along the Colorado River.
The white colored rock (approximately 100ft high) shows the drop in the water level of Lake Mead as a result of the ongoing 10-year drought along the Colorado River.

PubTalk 3/2010 — Changing Times-- A Changing Planet!
Using phenology to take the pulse of our planet
By Jake F. Weltzin, Executive Director, USA National Phenology Network
Using phenology to take the pulse of our planet
By Jake F. Weltzin, Executive Director, USA National Phenology Network

USGS Public Lecture Series: Baked Alaska--What's Happening to the Glaciers in Alaska?
Glaciers are Earth's largest reservoir of freshwater. As they change, so does global sea level. Alaska has one of the largest accumulations of glaciers anywhere on Earth outside of the Polar regions. For most of the past half century, Alaska has experienced a significant increase in temperature that has profoundly impacted its glaciers. Join USGS scientist Dr.
Glaciers are Earth's largest reservoir of freshwater. As they change, so does global sea level. Alaska has one of the largest accumulations of glaciers anywhere on Earth outside of the Polar regions. For most of the past half century, Alaska has experienced a significant increase in temperature that has profoundly impacted its glaciers. Join USGS scientist Dr.

USGS Public Lecture Series: Climate Change 101
Climate change is an issue of increasing public concern because of its potential effects on land, water, and biological resources.
Climate change is an issue of increasing public concern because of its potential effects on land, water, and biological resources.

USGS Public Lecture Series: Watching Nature's Clock: A Citizen-Scientist Effort to Track Seasonal Signs of Climate Change
linkA new USGS program, the USA National Phenology Network, is recruiting tens of thousands of volunteers to team up with scientists to help track the effects of climate on seasonal patterns of plant and animal behavior.

Drew Point, AK Time-Lapse Photography of Coastal Erosion
4-week time-lapse photography of the Arctic coast at Drew Point, AK shows intense coastal erosion in early July, 2008
4-week time-lapse photography of the Arctic coast at Drew Point, AK shows intense coastal erosion in early July, 2008

Vegetation Drought
The Vegetation Drought Response Index (VegDRI) incorporates satellite observations of vegetation to monitor at a finer spatial detail than other commonly used drought indicators.
The Vegetation Drought Response Index (VegDRI) incorporates satellite observations of vegetation to monitor at a finer spatial detail than other commonly used drought indicators.

Crumbling blocks of permafrost along the Beaufort Coast
Crumbling blocks of permafrost along the Beaufort Coast
Crumbling blocks of permafrost along the Beaufort Coast
Related Content
- FAQ
Does an increase in the 100-year flood estimate originate from climate or land-use change?
Climate variability (dry cycles to wet cycles) and land-use change play a significant role, but there is a large amount of uncertainty around the flood quantile estimates (the value of discharge corresponding to the 100-year flood), particularly if there isn’t a long record of observed data at a stream location. Learn more: The 100-Year Flood The 100-Year Flood--It's All About Chance
What are the long-term effects of climate change?
Scientists have predicted that long-term effects of climate change will include a decrease in sea ice and an increase in permafrost thawing, an increase in heat waves and heavy precipitation, and decreased water resources in semi-arid regions. Below are some of the regional impacts of global change forecast by the Intergovernmental Panel on Climate Change: North America: Decreasing snowpack in the...
What is the difference between weather and climate change?
Weather refers to short term atmospheric conditions while climate is the weather of a specific region averaged over a long period of time. Climate change refers to long-term changes.
How can climate change affect natural disasters?
With increasing global surface temperatures the possibility of more droughts and increased intensity of storms will likely occur. As more water vapor is evaporated into the atmosphere it becomes fuel for more powerful storms to develop. More heat in the atmosphere and warmer ocean surface temperatures can lead to increased wind speeds in tropical storms. Rising sea levels expose higher locations...
How do changes in climate and land use relate to one another?
The link between land use and the climate is complex. First, land cover--as shaped by land use practices--affects the global concentration of greenhouse gases. Second, while land use change is an important driver of climate change, a changing climate can lead to changes in land use and land cover. For example, farmers might shift from their customary crops to crops that will have higher economic...
How do we know the climate is changing?
The scientific community is certain that the Earth's climate is changing because of the trends that we see in the instrumented climate record and the changes that have been observed in physical and biological systems. The instrumental record of climate change is derived from thousands of temperature and precipitation recording stations around the world. We have very high confidence in these...
What is the difference between global warming and climate change?
Although people tend to use these terms interchangeably, global warming is just one aspect of climate change. “Global warming” refers to the rise in global temperatures due mainly to the increasing concentrations of greenhouse gases in the atmosphere. “Climate change” refers to the increasing changes in the measures of climate over a long period of time – including precipitation, temperature, and...
Why is climate change happening and what are the causes?
There are many “natural” and “anthropogenic” (human-induced) factors that contribute to climate change. Climate change has always happened on Earth, which is clearly seen in the geological record; it is the rapid rate and the magnitude of climate change occurring now that is of great concern worldwide. Greenhouse gases in the atmosphere absorb heat radiation. Human activity has increased...
How do we know glaciers are shrinking?
Repeat photography and aerial / satellite photo analysis provide evidence of glacier loss in terms of shape and area. The USGS Benchmark Glacier project has collected mass balance data on a network of glaciers in Alaska, Washington, and Montana for decades, quantifying trends of mass loss at all sites. Extensive field data collection at these sites includes twice yearly visits to measure seasonal...
How does carbon get into the atmosphere?
Atmospheric carbon dioxide comes from two primary sources—natural and human activities. Natural sources of carbon dioxide include most animals, which exhale carbon dioxide as a waste product. Human activities that lead to carbon dioxide emissions come primarily from energy production, including burning coal, oil, or natural gas. Learn more: Sources of Greenhouse Gas Emissions (EPA)
How much carbon dioxide does the United States and the World emit each year from energy sources?
The U.S. Energy Information Administration estimates that in 2019, the United States emitted 5,130 million metric tons of energy-related carbon dioxide, while the global emissions of energy-related carbon dioxide totaled 33,621.5 million metric tons.
What is carbon sequestration?
Carbon dioxide is the most commonly produced greenhouse gas. Carbon sequestration is the process of capturing and storing atmospheric carbon dioxide. It is one method of reducing the amount of carbon dioxide in the atmosphere with the goal of reducing global climate change. The USGS is conducting assessments on two major types of carbon sequestration: geologic and biologic .
- Multimedia
Rainbow Glacier perimeter: 1966, 1998, 2005, 2015.
This image shows the perimeter of Rainbow Glacier in Glacier National Park: 1966, 1998, 2005, 2015.
This image shows the perimeter of Rainbow Glacier in Glacier National Park: 1966, 1998, 2005, 2015.
USGS Public Lecture: Warm Ice—Dynamics of Rapidly Changing Glaciers- Glacier Numerology – The how big, how long, how thick, how much, how often, of glacier science.
- Glacier Photography – While a picture may be worth a thousand words, a collection of images may tell a complete forensic story.
- Glacier Numerology – The how big, how long, how thick, how much, how often, of glacier science.
- Glacier Photography – While a picture may be worth a thousand words, a collection of images may tell a complete forensic story.
Permafrost Study in the Yukon River BasinJay Hootch, former employee of Yupitt of Andreafski, drills to take winter chemistry samples to be used in a permafrost loss study in the Yukon River Basin.
Jay Hootch, former employee of Yupitt of Andreafski, drills to take winter chemistry samples to be used in a permafrost loss study in the Yukon River Basin.
Permafrost Study in the Yukon River BasinHeading out to take water chemistry samples for a study on permafrost in the Yukon River Basin. The study examined the chemical and hydrological changes occurring in the basin due to permafrost loss.
Heading out to take water chemistry samples for a study on permafrost in the Yukon River Basin. The study examined the chemical and hydrological changes occurring in the basin due to permafrost loss.
Peeking into PermafrostBarter Island sits at the top of the Arctic National Wildlife Refuge in Alaska, and with the Arctic facing quickly rising temperatures, USGS wants to investigate what’s causing the North Slope bluffs to erode so quickly.
Barter Island sits at the top of the Arctic National Wildlife Refuge in Alaska, and with the Arctic facing quickly rising temperatures, USGS wants to investigate what’s causing the North Slope bluffs to erode so quickly.
Allen Bondurant measuring the depth to permafrost along a thermokarst lake shore.Allen Bondurant measuring the depth to permafrost along a thermokarst lake shore.
Allen Bondurant measuring the depth to permafrost along a thermokarst lake shore.
PubTalk 11/2012 — Understanding Climate-Wildlife Relationships-- are American pikas harbingers of changing conditions?
by USGS Research Ecologist Erik Beever
-- are American pikas harbingers of changing conditions?
by USGS Research Ecologist Erik Beever
Drought EffectThe white colored rock (approximately 100ft high) shows the drop in the water level of Lake Mead as a result of the ongoing 10-year drought along the Colorado River.
The white colored rock (approximately 100ft high) shows the drop in the water level of Lake Mead as a result of the ongoing 10-year drought along the Colorado River.
PubTalk 3/2010 — Changing Times-- A Changing Planet!Using phenology to take the pulse of our planet
By Jake F. Weltzin, Executive Director, USA National Phenology Network
Using phenology to take the pulse of our planet
By Jake F. Weltzin, Executive Director, USA National Phenology Network
USGS Public Lecture Series: Baked Alaska--What's Happening to the Glaciers in Alaska?Glaciers are Earth's largest reservoir of freshwater. As they change, so does global sea level. Alaska has one of the largest accumulations of glaciers anywhere on Earth outside of the Polar regions. For most of the past half century, Alaska has experienced a significant increase in temperature that has profoundly impacted its glaciers. Join USGS scientist Dr.
Glaciers are Earth's largest reservoir of freshwater. As they change, so does global sea level. Alaska has one of the largest accumulations of glaciers anywhere on Earth outside of the Polar regions. For most of the past half century, Alaska has experienced a significant increase in temperature that has profoundly impacted its glaciers. Join USGS scientist Dr.
USGS Public Lecture Series: Climate Change 101Climate change is an issue of increasing public concern because of its potential effects on land, water, and biological resources.
Climate change is an issue of increasing public concern because of its potential effects on land, water, and biological resources.
USGS Public Lecture Series: Watching Nature's Clock: A Citizen-Scientist Effort to Track Seasonal Signs of Climate ChangeUSGS Public Lecture Series: Watching Nature's Clock: A Citizen-Scientist Effort to Track Seasonal Signs of Climate Change
linkA new USGS program, the USA National Phenology Network, is recruiting tens of thousands of volunteers to team up with scientists to help track the effects of climate on seasonal patterns of plant and animal behavior.
USGS Public Lecture Series: Watching Nature's Clock: A Citizen-Scientist Effort to Track Seasonal Signs of Climate Change
linkA new USGS program, the USA National Phenology Network, is recruiting tens of thousands of volunteers to team up with scientists to help track the effects of climate on seasonal patterns of plant and animal behavior.
Drew Point, AK Time-Lapse Photography of Coastal Erosion4-week time-lapse photography of the Arctic coast at Drew Point, AK shows intense coastal erosion in early July, 2008
4-week time-lapse photography of the Arctic coast at Drew Point, AK shows intense coastal erosion in early July, 2008
Vegetation DroughtThe Vegetation Drought Response Index (VegDRI) incorporates satellite observations of vegetation to monitor at a finer spatial detail than other commonly used drought indicators.
The Vegetation Drought Response Index (VegDRI) incorporates satellite observations of vegetation to monitor at a finer spatial detail than other commonly used drought indicators.
Crumbling blocks of permafrost along the Beaufort CoastCrumbling blocks of permafrost along the Beaufort Coast
Crumbling blocks of permafrost along the Beaufort Coast
- Publications
- News