
The NOAA 1/4° Daily Optimum Interpolation Sea Surface Temperature (OISST) is a long term Climate Data Record that incorporates observations from different platforms (satellites, ships, buoys and Argo floats) into a regular global grid. The dataset is interpolated to fill gaps on the grid and create a spatially complete map of sea surface temperature. Satellite and ship observations are referenced to buoys to compensate for platform differences and sensor biases.
Version 2.1
OISST v2.1 replaced v2 on April 1, 2020. V2 stopped production on April 26, 2020 after its input datasets were discontinued. Data are currently available from September 1, 1981—present, and updated every day. V2.1 has significant quality improvements for data from January 1, 2016 onward.
Note: For September 1981—December 2015, data for SST and SST anomaly are the same as v2, but have been updated from netCDF3 to netCDF4 with updated metadata in v2.1.
Gridded Data
Advanced Very High Resolution Radiometer (AVHRR)-Only data in netCDF format
Note: NetCDF data can’t be accessed via ftp, use wget or curl
Advanced Microwave Scanning Radiometer (AMSR)+AVHRR and AVHRR-Only data
Version 2.1 Improvements
- See Huang et al. 2021 for complete details
- In-Situ ship and buoy data changed from the National Centers for Environmental Prediction (NCEP) Traditional Alphanumeric Codes (TAC) to NCEI merged TAC + Binary Universal Form for the Representation (BUFR) of meteorological data, with large increases of buoy data included to correct satellite SST biases.
- Argo float SST observations have been added to provide additional correction for satellite SST biases.
- Satellite input from the Metop-A and NOAA-19 to Metop-A and Metop-B have replaced degraded satellite data.
- Ship-buoy SST correction methods have been revised to improve accuracy.
- The sea-ice-concentration to SST conversion method has been revised to remove warm biases in the Arctic region.
*Improvements implemented for data from January 2016—Present
Additional Data
Three other maps at the same 1/4° spatial resolution complement the daily OISST:
- Anomalies (i.e., the daily OISST minus a 30-year climatological mean) represent departures from "normal" or average conditions. Computation of several climate indices, such as the El Niño index, utilize SST anomalies.
- The error field provides a measure of confidence or quality, allowing users to exclude (using a threshold) or to minimize (using weights) the impact of daily OISST values with greater interpolation errors.
- The seven-day median of daily sea ice concentrations serves as the basis for proxy SSTs in the marginal ice zone, where observations are lacking. The proxy SST allows interpolation of temperatures from the open ocean to the seasonal sea ice margin.
NOAA's Weather and Climate Toolkit
Free, downloadable data visualization software
ERDDAP
Visualization and subsetting software
Live Access Server (LAS)
Subsetting software available through the NASA Jet Propulsion Laboratory (JPL)
Note: JPL is the centralized data distributor for the Group for High-Resolution Sea Surface Temperatures, and provides access to other SST products. Please contact JPL directly for assistance with their website and tools.
OISST Climate Data Record
NOAA's Climate Data Records (CDRs) are robust, sustainable, and scientifically sound datasets that provide trustworthy information on how, where, and to what extent the land, oceans, atmosphere and ice sheets are changing. CDRs are thoroughly vetted time series measurements with the longevity, consistency, and continuity to assess and measure climate variability and change. They are vetted using standards established by the National Research Council (NRC).
Product History
OISST belongs to a family of products that are sometimes referred to as "Reynolds SST" for Richard W. Reynolds, a NOAA scientist who worked to improve the accuracy of the SST analyses by optimizing the advantages of in situ (ship and buoy) and satellite data. Older Reynolds SST products have been retired, except for the 1° weekly OISST. The dataset was developed using a methodology that includes bias adjustment of satellite and ship observations (referenced to buoys) to compensate for platform differences and sensor biases. This proved critical during the Mt. Pinatubo eruption in 1991, when the widespread presence of volcanic aerosols resulted in infrared satellite temperatures that were much cooler than actual ocean temperatures (Reynolds 1993).
The two papers below are the most appropriate references for 1/4° Daily OISST. To cite the dataset, use the first paper. The second reference describes the 1/4° daily OISST when it was first released, and goes through the methodology in great detail.
- Huang, B., C. Liu, V. Banzon, E. Freeman, G. Graham, B. Hankins, T. Smith, and H.-M. Zhang, 2020: Improvements of the Daily Optimum Interpolation Sea Surface Temperature (DOISST) Version 2.1, Journal of Climate, 34, 2923-2939. doi: 10.1175/JCLI-D-20-0166.1
- Banzon, V., Smith, T. M., Chin, T. M., Liu, C., and Hankins, W., 2016: A long-term record of blended satellite and in situ sea-surface temperature for climate monitoring, modeling and environmental studies. Earth Syst. Sci. Data, 8, 165–176, doi:10.5194/essd-8-165-2016
- Reynolds, R. W., T. M. Smith, C. Liu, D. B. Chelton, K. S. Casey, and M. G. Schlax, 2007: Daily high-resolution-blended analyses for sea surface temperature. Journal of Climate, 20, 5473–5496, doi:10.1175/JCLI-D-14-00293.1
The articles listed below cover a wide range of topics relevant to OISST, including a description of earlier versions, SST climatologies, and intercomparisons with other SST products.
- Huang, B., C. Liu, G. Ren, H.-M. Zhang, and L. Zhang, 2019: The role of buoy and Argo observations in two SST analyses in the global and tropical Pacific oceans. J. Climate, doi:10.1175/JCLI-D-18-0368.1.
- Huang, B., C. Liu, V. F. Banzon, H.-M. Zhang, T. R. Karl, J. H. Lawrimore, R. S. Vose, 2016: Assessing the impact of satellite-based observations in sea surface temperature trends. Geophys. Res. Lett., 43, doi:10.1002/2016GL068757.
- Huang, B., W. Wang, C. Liu, V. F. Banzon, J. Lawrimore, and H.-M. Zhang, 2015: Bias adjustment of AVHRR SST and its impacts on two SST analyses. J. Atmos. Oceanic Technol., 32, 372-387, doi:10.1175/JTECH-D-14-00121.1.
- Banzon, V. F., R. W. Reynolds, D. Stokes, and Y. Xue, 2014: A 1/4° spatial resolution daily sea surface temperature climatology based on a blended satellite and in situ analysis. Journal of Climate, 27, 8221–8228, doi:10.1175/JCLI-D-14-00293.1
- Banzon, V. F., and R. W. Reynolds, 2013: Use of WindSat to extend a microwave-based daily optimum interpolation sea surface temperature time series. Journal of Climate, 26, 2557–2562, doi:10.1175/JCLI-D-12-00628.1
- Huang, B. and Coauthors, 2013: Why did large differences arise in the sea-surface temperature datasets across the tropical Pacific during 2012? JTECH, 30, 2944-2953, doi:10.1175/JTECH-D-13-00034.1.
- Reynolds, R. W., D. B. Chelton, J. Roberts-Jones, M. J. Martin, D. Menemenlis, and C. J. Merchant, 2013: Objective determination of feature resolution in two sea surface temperature analyses. Journal of Climate, 26, 2514–2533, doi:10.1175/JCLI-D-12-00787.1
- Reynolds, R. W., and D. B. Chelton, 2010: Comparisons of daily sea surface temperature analyses for 2007-08. Journal of Climate, 23, 3545–3562, doi:10.1175/2010JCLI3294.1
- Reynolds, R.W., C. L. Gentemann, and G. K. Corlett, 2010: Evaluation of AATSR and TMI satellite SST data. Journal of Climate, 23, 152–165, doi:10.1175/2009JCLI3252.1
- Xue, Y., T. M. Smith, and R. W. Reynolds, 2003: Interdecadal changes of 30-yr SST normals during 1871–2000. Journal of Climate, 16, 1601–1612, doi:10.1175/1520-0442-16.10.1601.
- Reynolds, R. W., N. A. Rayner, T. M. Smith, D. C. Stokes, and W. Wang, 2002: An improved in situ and satellite SST analysis for climate. Journal of Climate, 15, 1609–1625, doi:10.1175/1520-0442(2002)015%3C1609:AIISAS%3E2.0.CO;2
- Smith, T. M., and R. W. Reynolds, 1998: A high-resolution global sea surface temperature climatology for the 1961–90 base period. Journal of Climate, 11, 3320–3323, doi:10.1175/1520-0442(1998)011%3C3320:AHRGSS%3E2.0.CO;2
- Reynolds, R. W., and T. M. Smith, 1995: A high-resolution global sea surface temperature climatology. Journal of Climate, 8, 1571–1583, doi:10.1175/1520-0442(1995)008%3C1571:AHRGSS%3E2.0.CO;2
- Reynolds, R. W., and T. M. Smith, 1994: Improved global sea surface temperature analyses. Journal of Climate, 7, 929–948, doi:10.1175/1520-0442(1994)007%3C0929:IGSSTA%3E2.0.CO;2
- Reynolds, R. W., and D. C. Marsico, 1993: An improved real-time global sea surface temperature analysis. Journal of Climate, 6, 114–119, doi:10.1175/1520-0442(1993)006%3C0114:AIRTGS%3E2.0.CO;2
- Reynolds, R. W., 1993: Impact of Mount Pinatubo aerosols on satellite-derived sea surface temperatures. Journal of Climate, 6, 768–774, doi:10.1175/1520-0442(1993)006%3C0768:IOMPAO%3E2.0.CO;2
- Reynolds, R.W., 1988: A real-time global sea surface temperature analysis. Journal of Climate, 1, 75–86, doi:10.1175/1520-0442(1988)001%3C0075:ARTGSS%3E2.0.CO;2
Frequently Asked Questions
Is the 1/4° daily OISST the same as the Reynolds SST?
The 1/4° daily OISST belongs to a family of products that are sometimes referred to as "Reynolds SST" after Richard W. Reynolds who (along with Thomas Smith) developed methodologies for producing interpolated gridded SSTs when they were working at the National Centers for Environmental Prediction (NCEP). Older Reynolds SST products have been retired.
What is the 1° weekly OISST and how is it different from the 1/4° daily OISST?
The earliest OISST analyses were at lower spatial and temporal resolution. This includes the NOAA 1° weekly OISST (version 2) available at NCEP, described in Reynolds et al. (2002), and referred to as OI.V2. NCEP also runs a copy of the daily OISST software for internal use. This and the fact that weekly and daily analyses are both at version 2 often leads to confusion. Weekly OISST is not a seven day average of 1/4° daily OISST; it uses a week of satellite observations averaged onto a 1° grid prior to interpolation. Daily OISST uses a day of satellite observations averaged onto the 1/4° grid. There are other methodological differences between the two products, discussed in the references previously mentioned. As of Dec. 05, 2022, the 1° weekly OISST at NCEP has been discontinued.
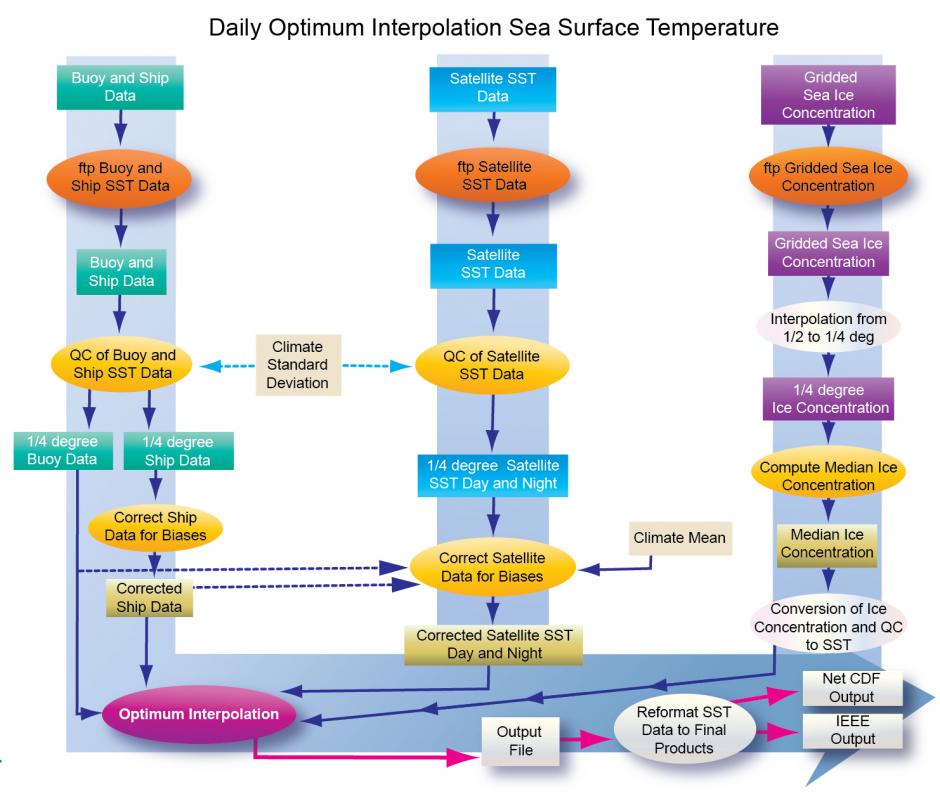
What are the inputs to the daily OISST and how are they processed?
There are three inputs to the daily OISST: buoy and ship (in situ) sea surface temperature (SST), satellite SST, and gridded sea ice concentration. Each input has a different preparation method, as described in Reynolds et al. (2007). The in situ SSTs need to be checked for outliers, and then averaged onto the 1/4° grid, separately for ships and buoys. The ship data are adjusted to the buoys by subtracting a constant 0.14°C. Similarly, satellite temperatures are averaged onto the analysis grid, after which they are bias-adjusted to the in situ data. For the marginal ice zone, where there is little in situ data, proxy SSTs are generated from sea ice concentrations. The interpolation step combines the prepared inputs. Banzon et al. (2016) provides more details on the input datasets used.
What climatology is used to compute the SST anomalies?
The climatology used to compute the daily OISST anomalies, available from NCEP, represents the 1971–2000 base period and is interpolated to 1/4° daily grid file from the 1° monthly file. The climatology is described in Xue et al. (2003).


