


Abstract
Associations between soy, dairy intakes and breast cancer risk are inconsistent. No studies exist with large numbers of dairy consumers and soy consumers to assess mutual confounding.
The study cohort contains 52 795 North American women, initially free of cancer, followed for 7.9 years (29.7% were Black). Dietary intakes were estimated from food frequency questionnaires and, for 1011 calibration study subjects, from six structured 24-h dietary recalls. Incident invasive breast cancers were detected mainly by matching with cancer registries. Analyses used multivariable proportional hazards regression.
The participants (mean age of 57.1 years) experienced 1057 new breast cancer cases during follow-up. No clear associations were found between soy products and breast cancer, independently of dairy. However, higher intakes of dairy calories and dairy milk were associated with hazard ratios (HRs) of 1.22 [95% confidence interval (CI): 1.05–1.40] and 1.50 (95% CI 1.22–1.84), respectively, comparing 90th to 10th percentiles of intakes. Full fat and reduced fat milks produced similar results. No important associations were noted with cheese and yogurt. Substituting median intakes of dairy milk users by those of soy milk consumers was associated with HR of 0.68 (95% CI: 0.55–0.85). Similar-sized associations were found among pre- and post-menopausal cases, with CIs also excluding the null in estrogen receptor (ER+, ER-), and progesterone receptor (PR+) cancers. Less biased calibrated measurement-error adjusted regressions demonstrated yet stronger, but less precise, HRs and CIs that still excluded the null.
Higher intakes of dairy milk were associated with greater risk of breast cancer, when adjusted for soy intake. Current guidelines for dairy milk consumption could be viewed with some caution.
After adjusting for soy, dairy milk is positively associated with risk of breast cancer in this population with diverse dietary habits.
The association is non-linear, with strongest slope in risk at relatively low doses (≤1 8 ounce cup/day).
No associations with soy had confidence intervals that excluded the null, although there were inverse trends between total isoflavone consumption and risk.
This evidence that a frequently consumed product, dairy milk, is associated with increased risk of a common cancer is noteworthy, as plausible causal hypotheses have already been raised by others on biological grounds.
Introduction
It is estimated that one in eight women in the USA will develop invasive breast cancer during their lifetime, with 268 600 cases expected in 2020.1 Known modifiable risk factors for breast cancer include alcohol consumption,2 physical activity,3 body mass index (BMI),4 oral contraceptive use,5 breast feeding6 and other markers of estrogen/progestogen exposure.7 Results have been inconsistent for virtually all nutritional factors to date.8 In particular this includes soy and dairy intakes.
Both soy and dairy have been hypothesized to affect risk of breast cancer in opposite directions.9,10 Intakes of these two food groups are often negatively correlated, but have rarely been adjusted for each other. Thus, soy foods are often good indicators of less dairy or its absence.
The Adventist Health Study-2 (AHS-2) is a large cohort of North American Adventists. Nearly 40% are strict (no meats, eggs, dairy) or lacto-ovo-vegetarians (eggs and dairy allowed) who often consume soy as a protein source and obtain most dietary calcium (79.6%) from non-dairy sources.11,12 Half of the cohort averages nearly 68 g of soy foods eaten daily,11,12 compared with 2 g/day (d) in men and about 3 g/d in women living in 10 European countries.13 About 8% of the AHS-2 population consume no dairy and the lacto-ovo-vegetarians are low-dairy (mean, 60% of usual US levels), but about 50% consume as much as other Americans.
We evaluate associations between intakes of soy milk, other soy products, dairy milk and other dairy foods with risk of breast cancer, noting that U.S. Dietary Guidelines14 recommend the consumption of 710 ml (approximately three 8 ounce cups, 450 kcals) of milk per day. The AHS-2 cohort can evaluate independent associations between soy, dairy consumption and breast cancer incidence with unusual clarity.
Methods
Study population
The recruitment process and characteristics of the AHS-2 cohort have been described previously.15 Briefly, 52 795 female participants (aged 30 years and older) were recruited from Adventist churches throughout the USA and Canada from 2002 to 2007, 19 352 providing person-time in premenopausal years. The institutional review board of Loma Linda University approved the study, and participants provided written informed consent.
We excluded women residing in Maine (and several Canadian provinces with few AHS-2 subjects) due to lack of registry match data (n = 656 subjects), prevalent cancer (excluding non-melanoma skin cancer) (n = 5120), missing valid consent form (n = 12), unreliable dietary data [invalid responses (n = 435) or >69 missing values (n = 1451)], extreme energy intake <500 kcal/d or >4500 kcal/d (n = 2111), extreme BMI <14 or >60 (n = 143), extreme height >84 inches (n = 6), missing or invalid date of birth (n = 210) or age <25 years at enrolment (n = 6). Thus the analytical sample consists of 52 795 women (84.8% of the female cohort).
Breast cancer ascertainment
Incident invasive breast cancer cases, 84.9% of whom had information on estrogen (ER) and progesterone (PR) receptor status, were identified by computer matching AHS-2 participants to data from 53 cancer registries (except Maine, but including Washington DC, Ontario, Alberta and British Columbia). For most, an AHS-2 programmer performed the linkage at registry offices; otherwise the registry staff performed the linkage, which at this time is complete through 2011 or 2012. In addition, cases identified in biennial follow-up questionnaires, but not already matched through a cancer registry, were confirmed by medical record reviews. International Classification of Diseases for Oncology (ICD-O-3)16 codes C50.0-C50.9 identified invasive breast cancers.
Dietary assessment
Diet during the preceding year was assessed by food frequency questionnaire (FFQ) obtained at cohort enrolment. This included 51 items relating to soy intake, 17 items about dairy intake and questions about meats, nuts/seeds and other dietary items. Soy items included 40 commercially prepared meat analogues, 15 listed and two open-ended soy milk items, questions about tofu and soybeans and also soy isoflavone supplementation.
Nutrient composition was calculated using the Nutrition Data System for Research (the NDS-R 2008) database.17 For products not found there, study nutritionists and a food technologist created recipes based on food label ingredients. Soy and dairy components of mixed dishes and products were identified mainly by the NDS database (more details in Supplement 2 to this article, available as Supplementary data at IJE online). All dietary variables were energy-adjusted using the residual method.18 Because of the high water content of the milks, we use kcal/day as the unit for dairy. Approximate conversions are whole dairy milk 0.63 kcal/g; cheese 3.2-3.9 kcal/g; yogurt 0.6-0.9 kcal/g. Soy milk conversions are variable but ∼1.0 kcal/g.
A calibration study group (542 women representative of the female cohort),12,19 provided an overnight urine specimen and six structured 24-h dietary recalls (24DR) using NDS-R 4.06 or 5. The 24 DRs were the reference dietary data for regression calibration and used to validate the FFQ.12,19 In non-Black women, correlations between FFQ and 24DR were 0.63 (soy protein), 0.66 (meat analogues), 0.62 (tofu and soybeans), 0.63 (soy milks), 0.86 (all dairy), 0.76 (cheese), 0.59 (milk and yogurt—regular fat), 0.71 (milk and yogurt—reduced fat) and 0.63 (total calcium). Similar correlations in Black women were 0.40, 0.62, 0.46, 0.39, 0.82, 0.62, 0.48, 0.63 and 0.73. Soy protein intake from FFQ also correlated with overnight urinary total isoflavones (plus equol) (0.57 in all subjects, i.e. men and women, and 0.50 in soy users).20
Non-dietary covariate data
The baseline questionnaire provided self-reported information on demographics, family history of breast cancer, physical activity, alcohol consumption, anthropometrics, past and current (i.e. at study baseline) hormonal and other medication use, breast cancer screening, reproductive and gynecological history. Ethnicity options assigned as ‘Black’ had subcategories of African-American, West Indian/Caribbean, African, Other. More covariate details are provided in Supplement 1, available as Supplementary data at IJE online.
Statistical analyses
Hazard ratios (HR) for breast cancer and 95% confidence intervals (CI) were estimated from Cox proportional hazards regressions. P for trend was estimated using two-sided Wald tests, for log-transformed [log(X + 1)] dietary variables. All dietary variables were modelled in regressions as continuous variables and were log-transformed as most had markedly positive skews, being bounded at the lower but not upper end. Attained age was the time variable with left-truncation at enrolment age. Censoring occurred at date of cancer diagnosis, death, the last date on which the relevant cancer registry reported complete data, or date of subject’s relocation outside that cancer registry area. Relative risk estimates, back-transformed to original X units, were calculated as: (Xupper + 1)/(Xlower + 1)β, where Xupper and Xlower are exposure levels to be compared (as point values in a continuous scale) and β is the regression coefficient for log(X + 1). Menopausal status was treated as a time-dependent covariate.
Model 1 included only non-dietary covariates (see footnotes to the tables). Model 2 included additional dietary covariates, as indicated, all selected a priori. Several other dietary variables, including other fruits and vegetables, were tested but excluded, as none was influential. For hormone receptor-specific analyses, competing risk proportional hazards analyses used the method described by Xue et al.21 which allows a formal comparison between receptor types.
As soy milk and other foods are often substituted for dairy milks and cheeses by this population, substitution analyses were run based on the relevant regression coefficients of the analytical model, as has been used by others.22,23 Specifically, we replaced the median intake (log-transformed) of users of soy (M1) with that of dairy users (M2). Then the difference (β2.M2 –β1.M1) and the relevant covariances provide the contrasts of interest. We also evaluated whether the proportion of dairy milk as reduced fat modified the total dairy milk term. This was achieved by adding a product term between an indicator variable of any dairy milk consumption (yes/no) and kcals of reduced fat milk, this in addition to the total milk variable.
The proportionality assumption was evaluated using Schoenfeld residuals.24 Multiple imputation, with appropriate standard errors,25 handled missing data (3–9% in particular dietary items), where possible using guided imputation to approximate the missing at random assumption.26,27
Measurement error correction by regression calibration28,29 used the AHS-2 calibration study FFQ, and the 24-h recalls as reference data. All covariates were included, and key dairy and soy variables (together) were calibrated conditional on all other covariates. BCa confidence intervals used 4000 bootstrap samples.30 Further details about regression calibration are provided in Supplement 2, available as Supplementary data at IJE online. A restricted cubic spline analysis, splining only the key exposure but containing all stated covariates, was performed with RMS software.31 All analyses used the R language.
Results
We identified 1057 incident breast cancer cases during 7.9 years’ average follow-up, 906 in post-menopausal women and 121 in women during premenopausal person-time.
Associations with covariates across quintiles of dairy consumption (Supplementary Table S1, available as Supplementary data at IJE online) and soy isoflavone consumption (Supplementary Table S2, available as Supplementary data at IJE online) were examined. Variables with larger negative trends across dairy quintiles are: age, race, exercise, intake of nuts and seeds, and isoflavones; larger positive trends are with alcohol (few users and small amounts), use of birth control pills, breast cancer screening, BMI, duration of hormone replacement therapy, intake of meats, and calcium. Variables with larger negative trends across isoflavone quintiles are: race (less in Blacks), BMI, intake of meats, dairy; larger positive trends are with exercise, duration of breastfeeding, intakes of nuts/seeds, and calcium.
Table 1 examines associations between dairy food intakes (primarily total dairy, and dairy milk) and risk of breast cancer, adjusting for soy. Comparing 90th with 10th percentiles (medians of extreme quintiles) on a continuous scale of dairy intakes (kcal/d), hazard ratio (HR) = 1.22 [95% confidence intervals (CI) 1.05–1.41], P = 0.008]. Comparing similar percentiles of dairy milk consumption, HR = 1.50 (95% CI 1.22–1.86, p < 0.001). In post-menopausal cases, the analogous results are HR = 1.23 (95% CI 1.05–1.45, P = 0.011), and 1.54 (95% CI 1.22–1.93, P <0.001). Associations in premenopausal women are in the same direction, though power is less and confidence intervals are wider, including the null. The HR comparing extremes of dairy calorie intakes = 1.19 (95% CI 0.81–1.74, P = 0.37), and for dairy milk intakes HR = 1.37 (95% CI 0.78–2.41, P = 0.28).
Relative risk (RR) (95% CI) estimates of breast cancer risk in North American women comparing the median of extreme quintiles (lowest quintile as the reference) of dairy intake (kcals)
| Dairy exposure | RR | Extreme valuesa | (95% CI) | P for trend | RR | (95% CI) | P for trend |
|---|---|---|---|---|---|---|---|
| Model 1b | Model 2c | ||||||
| Total subjects | |||||||
| Total dairy kcal/d | 1.17 | 18.9/349 | 1.03–1.33 | 0.017 | 1.22 | 1.05–1.40 | 0.008 |
| Total dairy kcal/d | Regression calibration (extremes 12.2/265)d | 1.35 | 1.09–1.71 | 0.003 | |||
| Dairy milk kcal/d | 1.42 | 3.2/152 | 1.18–1.72 | <0.001 | 1.50 | 1.22–1.84 | <0.001 |
| Dairy milk_kcal/d | Regression calibration (extremes 1.2/105)d | 2.37 | 1.55–3.88 | <0.0001 | |||
| Dairy cheese kcal/d | 0.89 | 0/83.4 | 0.69–1.14 | 0.34 | 0.89 | 0.69–1.14 | 0.35 |
| Yogurt kcal/d | 0.92 | 0/68.5 | 0.78–1.10 | 0.36 | 0.98 | 0.82–1.17 | 0.80 |
| Dairy fat g/d | 1.13 | 1.9/20.5 | 0.95–1.34 | 0.15 | 1.13 | 0.93–1.36 | 0.22 |
| Dairy protein g/d | 1.17 | 1.0/20.4 | 0.99–1.40 | 0.067 | 1.23 | 1.01–1.51 | 0.042 |
| Dairy CHO g/d | 1.22 | 1.1/25.6 | 1.03–1.44 | 0.022 | 1.30 | 1.07–1.59 | 0.008 |
| Post-menopausal | |||||||
| Total dairy kcal/d | 1.17 | 14.9/346 | 1.02–1.35 | 0.032 | 1.23 | 1.05–1.45 | 0.011 |
| Dairy milk kcal/d | 1.44 | 2.7/153 | 1.16–1.77 | 0.001 | 1.54 | 1.22–1.93 | <0.001 |
| Dairy cheese kcal/d | 0.90 | 0/79 | 0.69–1.17 | 0.43 | 0.90 | 0.69–1.17 | 0.43 |
| Yogurt kcal/d | 0.89 | 0/67.7 | 0.74–1.07 | 0.22 | 0.94 | 0.78–1.14 | 0.55 |
| Dairy fat g/d | 1.11 | 1.7/19.5 | 0.92–1.33 | 0.28 | 1.10 | 0.90–1.35 | 0.36 |
| Dairy protein g/d | 1.15 | 1.0/20.5 | 0.96–1.38 | 0.14 | 1.22 | 0.98–1.52 | 0.073 |
| Dairy CHO g/d | 1.15 | 1.0/20.5 | 0.96–1.38 | 0.14 | 1.30 | 1.05–1.61 | 0.016 |
| Premenopausal | |||||||
| Total dairy kcal/d | 1.23 | 26.1/357 | 0.85–1.78 | 0.27 | 1.20 | 0.80–1.80 | 0.37 |
| Dairymilk kcal/d | 1.45 | 4.4/146 | 0.85–2.47 | 0.18 | 1.38 | 0.77–2.46 | 0.28 |
| Dairy cheese kcal/d | 0.78 | 0/90.8 | 0.36–1.66 | 0.52 | 0.81 | 0.38–1.72 | 0.58 |
| Yogurt kcal/d | 1.24 | 0/70.0 | 0.75–2.04 | 0.40 | 1.28 | 0.77–2.14 | 0.33 |
| Dairy fat g/d | 1.37 | 2.3/21.9 | 0.83–2.27 | 0.22 | 1.30 | 0.75–2.25 | 0.36 |
| Dairy protein g/d | 1.45 | 1.2/20.1 | 0.86–2.42 | 0.16 | 1.37 | 0.75–2.51 | 0.31 |
| Dairy CHO gm/d | 1.44 | 1.2/24.9 | 0.88–2.35 | 0.15 | 1.38 | 0.78–2.47 | 0.27 |
CHO, carbohydrate; d, day.
Extremes are medians of extreme quintiles of FFQ data, except as indicated for calibrated models.
Model 1: Cox proportional hazards regression analyses with the listed exposure of interest, plus adjustment for the following categorical variables: race [reference (ref = White], family history of breast cancer (ref = none), time since mammography (ref = never, nested among those greater than 50 years of age), menopausal status (ref = no), oral contraceptive use (ref = never), nulliparous (ref = yes), smoking (ref = never), alcohol duration of use, min/week of vigorous physical activity; and the following continuous variables: age at menarche, age at menopause among post-menopausal women, cumulative months of breastfeeding among parous women, number of children among parous women, age at first childbirth among parous women, duration of estrogen replacement therapy among post-menopausal women, duration of progestogen therapy among post-menopausal women, BMI, BMI*Menopausal status.
Model 2: main exposure variable, plus covariates as in model 1, also total calcium, unprocessed and processed red meats, poultry, fish, seeds and nuts. Total dairy calorie models and dairy macronutrient models (full models 2) also have total isoflavones as a covariate. Dairy food models have other dairy and other soy foods as covariates (full models 2). Dairy macronutrient models contain only the one named of the dairy macronutrients, due to collinearity. All dietary variables are modelled as continuous variables.
As is appropriate for the regression calibration analyses, the medians of extreme quintiles that are compared are those from the recalls.
CIs for HRs associating dairy cheese and yogurt intakes (Table 1) with risk always easily included the null (i.e. when HR = 1.0). When the highly correlated dairy macronutrients were included as the main exposure one at a time, the HR was greatest for dairy carbohydrate.
Many subjects used only reduced fat, only full-fat, or a mix of full-fat and reduced-fat milks. The model described in Statistical Analyses allows separation of the hazard estimates of these two types of milk (for details see footnote to Table 2). In Table 2, the estimated hazard ratios for breast cancer shows virtually identical results for full-fat and reduced-fat milk (comparing 90th with 10th percentile kcal values for total milk), although results for premenopausal women are less precise and point estimates differ moderately for the milk types.
Effects on risk of breast cancer of reduced-fat dairy milks compared with full-fat milk
| Dairy exposure | RR | Extreme valuesa | (95% CI) | P for trend | RR | (95% CI) | P for trend |
|---|---|---|---|---|---|---|---|
| Model 1b | Model 2c | ||||||
| Total subjects | |||||||
| Full-fat dairy milk kcal/d)d | 1.45 | 3.2/152 | 1.12–1.88 | 0.005 | 1.51 | 1.16–1.98 | 0.002 |
| Reduced-fat dairy milk (kcal/dd | 1.42 | 3.2/152 | 1.17–1.72 | 0.0004 | 1.53 | 1.24–1.88 | <0.0001 |
| Post-menopausal | |||||||
| Full-fat dairy milk kcal/d | 1.47 | 2.7/153 | 1.10–1.97 | 0.009 | 1.53 | 1.14–2.07 | 0.005 |
| Reduced-fat dairy milk kcal/d | 1.43 | 2.7/153 | 1.15–1.78 | 0.0012 | 1.55 | 1.23–1.94 | 0.0002 |
| Premenopausal | |||||||
| Full-fat dairy milk kcal/d | 1.39 | 4.4/146 | 0.66–2.90 | 0.39 | 1.49 | 0.69–3.19 | 0.31 |
| Reduced-fat dairy milk kcal/d | 1.46 | 4.4/146 | 0.84–2.56 | 0.18 | 1.59 | 0.88–2.88 | 0.13 |
Medians of extreme intake quintiles of total milk are used for both full-fat and reduced-fat milk, to ensure comparable contrasts.
Model 1: same variables as indicated in footnote to Table 1. Model 2: Covariates as in model 1, plus dairy calories, total calcium, unprocessed and processed red meats, poultry, fish, seeds and nuts.
These HRs use results from the model containing variables for total milk and reduced-fat milk as described in Statistical Analyses section. The full-fat milk HRs are derived from the coefficient for total milk alone, as this implies that reduced-fat milk is zero. The HR for reduced-fat milk alone comes from the given contrast being applied to the sum of both coefficients, as this implies the same milk quantities for both variables, hence all milk is reduced-fat. In this last case, the confidence intervals and P-values employ the necessary covariances between the beta coefficients.
We focus here on milks measured as kcal/d intake, given the high water content that influences a gram weight metric. Nevertheless, recognizing that if the hypothetical active principle is water soluble, a gram weight metric becomes of interest, and results where milks are measured as grams/d intake are shown in Supplementary Tables S3 and S4, available as Supplementary data at IJE online. The HRs there are very similar to those shown in Tables 1 and 3.
Relative risk (95% CI) estimates of breast cancer risk among North American women either comparing contrasting intakes of soy, or by substituting median values of soy users for median intakes of dairy users
| Soy exposure | HR | Extreme valuesa | (95% CI) | P for trend | HR | (95% CI) | P for trend |
|---|---|---|---|---|---|---|---|
| Model 1b | Model 2c | ||||||
| Total isoflavones mg/d | 0.84 | 0.30/44.0 | 0.71–1.00 | 0.046 | 0.89 | 0.72–1.09 | 0.24 |
| Total isoflavones mg/d | Regression calibration (extremes 0.3/36.2)d | 0.77 | 0.48–1.17 | 0.22 | |||
| Dietary isoflavones mg/d | 0.87 | 0.30/42.0 | 0.73–1.03 | 0.11 | 0.93 | 0.75–1.14 | 0.46 |
| Isoflavone supplement mg/d | 0.61 | 0/53.5 | 0.34–1.11 | 0.10 | 0.62 | 0.35–1.12 | 0.12 |
| Soy beans and tofu kcal/d | 0.86 | 0/61.4 | 0.71–1.03 | 0.10 | 0.92 | 0.75–1.11 | 0.38 |
| Meat analogues kcal/d | 1.05 | 0/180 | 0.86–1.28 | 0.65 | 1.02 | 0.83–1.27 | 0.84 |
| Soy milk kcal/d | 0.95 | 0/118 | 0.81–1.11 | 0.51 | 1.04 | 0.87–1.24 | 0.65 |
| Soy milk kcal/d | Regression calibration (extremes 0/108)d | 1.08 | 0.78–1.47 | 0.64 | |||
| Substituting dietary isoflavones/ dairy kcal/d | 0.76 | e | 0.60–0.95 | 0.014 | 0.68 | 0.53–0.87 | 0.002 |
| Substituting dietary isoflavones/ dairy kcal/d | Regression calibrationf | 0.59 | 0.41–0.82 | <0.001 | |||
| Substituting soy milk for dairy milk (kcal/d) | 0.76 | e | 0.62–0.92 | 0.005 | 0.68 | 0.55–0.85 | 0.001 |
| Substituting soy milk for dairy milk (kcal/d) | Regression calibrationf | 0.60 | 0.42–0.83 | 0.002 | |||
| Post-menopausal | |||||||
| Total isoflavones mg/d | 0.87 | 0.40/43.4 | 0.73–1.04 | 0.13 | 0.94 | 0.76–1.16 | 0.58 |
| Dietary isoflavones mg/d | 0.90 | 0.40/41.1 | 0.75–1.07 | 0.24 | 0.98 | 0.79–1.22 | 0.87 |
| Isoflavone supplement mg/d | 0.68 | 0/53.5 | 0.38–1.22 | 0.19 | 0.69 | 0.38–1.24 | 0.21 |
| Soy beans and tofu kcal/d | 0.88 | 0/59.0 | 0.73–1.07 | 0.20 | 0.95 | 0.77–1.17 | 0.64 |
| Meat analogues kcal/d | 1.07 | 0/174 | 0.87–1.33 | 0.52 | 1.07 | 0.85–1.34 | 0.58 |
| Soy milk kcal/d | 0.94 | 0/119 | 0.80–1.12 | 0.50 | 1.05 | 0.87–1.26 | 0.62 |
| Substituting dietary isoflavones/dairy kcal/d | 0.77 | e | 0.61–0.97 | 0.029 | 0.70 | 0.54–0.90 | 0.007 |
| Substituting soy milk for dairy milk (kcal/d) | 0.75 | e | 0.61–0.92 | 0.007 | 0.68 | 0.54–0.87 | 0.002 |
| Premenopausalg | |||||||
| Total isoflavones mg/d | 0.70 | 0.30/44.8 | 0.43–1.12 | 0.14 | 0.59 | 0.33–1.05 | 0.07 |
| Dietary isoflavones mg/d | 0.73 | 0.30/43.4 | 0.45–1.17 | 0.19 | 0.62 | 0.33–1.11 | 0.11 |
| Soy beans and tofu kcal/d | 0.69 | 0/65.4 | 0.39–1.19 | 0.18 | 0.66 | 0.37–1.19 | 0.17 |
| Meat analogues kcal/d | 0.93 | 0/188 | 0.53–1.62 | 0.79 | 0.81 | 0.44–1.47 | 0.48 |
| Soy milk kcal/d | 0.98 | 0/117 | 0.60–1.59 | 0.93 | 0.99 | 0.59–1.67 | 0.98 |
| Substituting dietary isoflavones/ dairy kcal/d | 0.65 | e | 0.32–1.34 | 0.24 | 0.55 | 0.25–1.20 | 0.13 |
| Substituting soy milk for dairy milk (kcal/d) | 0.81 | e | 0.45–1.46 | 0.48 | 0.70 | 0.36–1.38 | 0.31 |
Medians of extreme intake quintiles unless otherwise indicated for substitution analyses.
Model 1: same variables as indicated in footnote to Table 1. Where dietary isoflavones are the exposure, supplemental isoflavones are also always a covariate. Model 2: covariates as in model 1, plus dairy calories, total calcium, unprocessed and processed red meats, poultry, fish, seeds and nuts. Where soy foods are the exposure (model 1 and model 2), all these foods are in the same model, as are dairy foods (milk, cheese, yogurt) rather than dairy calories.
As is appropriate for the regression calibration analyses, the medians of extreme quintiles of recall intake values are compared. However, where zeroes are more than 20%, we compare the median of the upper quartile of users with zero intake.
Substituting median quantities of users (FFQ data). For all cases, substituting 11.2 mg/d isoflavones for 153.0 dairy kcal/d, or 47.5 kcal/d soy milk for 34.2 kcal/d dairy milk; for post-menopausal cases, substituting 10.8 mg/day isoflavones for 146.8 kcal/d dairy, or 48.8 kcal/d soy milk for 34.2 kcal/d dairy milk; for premenopausal cases, substituting 11.90 mg/d isoflavones for 163.7 kcal/d dairy, or 45.4 kcal/d soy milk for 34.3 kcal/d dairy milk. For substitutions, model 1 has the soy and dairy variables plus total calcium. Model 2 is as described in note (c) above.
Substituting median quantities of users (recall data) for the calibrated analyses; all cases only, substituting 9.1 mg/d dietary isoflavones for 123 kcal dairy foods; substituting 41.5 kcal/d of soy milk for 20.7 kcal/d of dairy milk.
Too few isoflavone supplementers for a meaningful analysis of isoflavone supplement associations.
Table 3 reports multivariable HRs between intakes of soy variables (primarily total soy measured as isoflavones, and soy milks) and risk of breast cancer. In the analysis for total cases, the HR for total isoflavone intake, not adjusted for dairy (Model 1), did appear to find a protective (but probably confounded) association that did not quite exclude the null. Among fully adjusted models including dairy, no HRs for soy variables had 95% CIs that excluded the null. In contrast, substitution analyses that modelled replacing the median intake (153.0 kcal/d) of dairy food users by the median intake of isoflavones (11.2 mg/d) among soy users, produced a hazard ratio of 0.68 (95% CI 0.53–0.87, P = 0.002). Replacing the median intakes of dairy milk (47.5 kcal/d) users by median of soy milk users (34.2 kcal/d) also found an HR of breast cancer of 0.68 (95% CI 0.55–0.85, P = 0.001).
Similarly, results for soy variables in post-menopausal and premenopausal women produced confidence intervals that included the null. However, among post-menopausal women, substitution analyses produce similar results to those from total cases, suggesting a relatively strong advantage of replacing the dairy with soy. Substituting medians of dairy-user calories by soy-user medians (isoflavones), HR = 0.70 (95% CI 0.54–0.90, P = 0.006), and when replacing medians of dairy milk by soy milk, HR = 0.68 (95% CI 0.54–0.87, P = 0.002).
Calibrated (measurement error-adjusted) analyses (total cases), when comparing medians of extreme quintiles of dairy intakes from dietary recalls (Table 1) found HR = 1.35 (95% CI 1.09–1.71, P = 0.003) and 2.37 (95% CI 1.55–3.88, P <0.0001) for dairy kcal and dairy milks, respectively. Substituting median intakes (soy product for dairy) with calibrated measurement-error adjusted analyses (Table 3) produced HR = 0.59 (95% CI 0.41–0.82, P <0.001) and 0.60 (95% CI 0.42–0.83, P = 0.002) for isoflavone/dairy kcal and soy milk/dairy milk substitutions.
Figure 1 examines associations between log(dairy milk kcal/d + 1) and incident breast cancer, including calibrated, uncalibrated and uncalibrated restricted cubic spline models. As the reference here is zero dairy milk calories, the HRs take larger values than those in the table where the midpoint of the lowest quintile was the reference. The splined and simpler un-splined results are close and not significantly different. In both cases the relatively linear form (on the log scale) indicates a rise in risk with relatively small doses of these foods. Thus, the rise in risk (back-transformed) is marked till about 120 kcal/d of dairy milk, with thereafter a progressively lessening slope. The lower bound of the less precise calibrated result indicates that the true result very likely has a greater slope than the uncalibrated line.
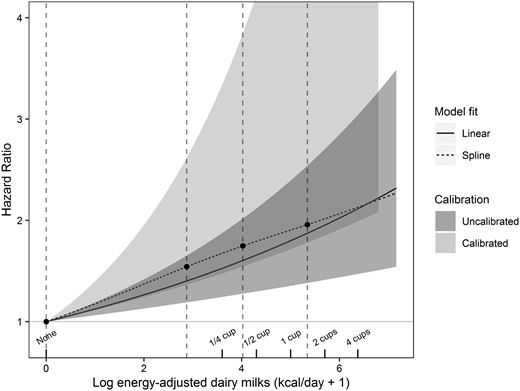
Plot of: (i) maximum likelihood regression and 95% confidence band uncalibrated log(dairy-milk kcal/day + 1) against the hazard ratio (HR) of incident breast cancera(darker grey); (ii) 95% confidence band (lighter grey) for the corresponding calibrated regression; (iii) vertical interrupted lines show positions of spline knots at the 5th, 35th, 65th and 95th percentiles of the non-zero values. Interrupted line is unrestricted cubic spline (uncalibrated) result. P-value that tests significance of the non-linear spline terms is 0.73, indicating that the log-transformation describes the data well. Cups are 8 ounce size.
Table 4 examines associations according to cancer hormone receptor sub-type, again comparing medians of extreme intake quintiles. As numbers were smaller, results are not stratified by menopausal categories. With greater dairy intake, there is greater associated risk of ER+/PR+ cancers (respectively for dairy and dairy milk calories, HR = 1.29, 95% CI 1.07–1.56, P = 0.007; and 1.43, 95% CI 1.11–1.83, P = 0.007), but no clear associations for other cancer receptor types. Grouping by ER and PR status separately, both total dairy and dairy milk intake were associated with increased risk for ER+ cancers, HR = 1.25 (95% CI 1.06–1.48, P = 0.008) and 1.36 (95% CI 1.08–1.71, P = 0.008), respectively; and also for PR+ cancers, HR = 1.30 (95% CI 1.08–1.56, P = 0.006) and HR = 1.45 (95% CI 1.13–1.86, P = 0.003), respectively. HRs for ER- cancers also suggested increased risk with higher dairy, as CIs were on the border of excluding the null. However, tests of differences in associations between these subtypes in all cases had P-values that were easily compatible with chance. All CIs for associations between soy variables and cancer hormone subtypes included the null value (not shown).
Associations between dairy variables and breast cancers classified by hormone receptor status.a Models each for total dairy and dairy milk, supporting results for: (a) estrogen receptor (ER) status; (b) progesterone receptor (PR) status; (c) combinations of ER/PR
| Dairy variable | Total dairy (kcal/d) | Dairy-milk (kcal/d) | |||||||
|---|---|---|---|---|---|---|---|---|---|
| Cancer receptor(s) | n(cases) | HRb | 95% CI | p1d | p2d | HRb | 95% CI | p1d | p2d |
| ER+ | 737 | 1.25 | 1.06–1.48 | 0.008 | 0.79 | 1.36 | 1.08–1.71 | 0.008 | 0.55 |
| ER− | 172 | 1.31 | 0.98–1.76 | 0.07 | – | 1.52 | 1.03–2.24 | 0.04 | – |
| PR+ | 615 | 1.30 | 1.08–1.56 | 0.006 | 0.43 | 1.45 | 1.13–1.86 | 0.003 | 0.36 |
| PR− | 282 | 1.17 | 0.94–1.56 | 0.16 | – | 1.22 | 0.89–1.66 | 0.22 | – |
| ER+/PR− | 116 | 1.06 | 0.77–1.47 | 0.71 | 0.56 | 0.98 | 0.62–1.53 | 0.92 | 0.42 |
| ER+/PR+ | 608 | 1.29 | 1.07–1.56 | 0.007 | 0.88 | 1.43 | 1.11–1.83 | 0.005 | 0.94 |
| ER−/PR− | 165 | 1.27 | 0.94–1.71 | 0.11 | 0.42 | 1.43 | 0.97–2.11 | 0.074 | 0.18 |
| ER−/PR+ | 7 | c | c | c | - | c | c | c | - |
Same covariates as those listed as footnotes to Table 1 for model 2.
Comparing medians of extreme quintiles of dairy intake.
Insufficient cases.
p1 relates to the test of whether the dairy variable has a CI that includes the null for that named cancer subtype; p2 relates to a test of whether the slope of association between the dairy variable differs between the named cancer subtype and that in the row below it. An exception is that the second to last line tests ER− /PR− vs ER+/PR−. Chi square joint Wald tests of no difference between the ER/PR combinations gave p = 0.80 (dairy kcals) and p = 0.58 (dairy milks).
Discussion
In this study of North American women with high average soy consumption, we found no convincing evidence that soy foods were associated with risk of breast cancer. However dairy foods, especially milk, were associated with increased risk, and there was a marked reduction in risk when substituting soy milk for an approximately equivalent quantity (medians of users) of dairy milk. The dairy and dairy milk associations were non-linear with greater slopes in the lower intake range, flattening somewhat by 90–100 calories (or 150 ml whole milk) per day. Cubic spline analyses confirmed the non-linearity. Calibrated regression results suggest that measurement errors are biasing the observed slopes downwards from greater true slopes. Risk of both ER+ and PR+ receptor cancers showed convincing positive associations with dairy consumption, but results among all receptor subtypes did not clearly differ from each other. The hazard ratios for risk of breast cancer comparing extremes of full-fat and reduced fat-milks were very similar.
Possible chemo-preventive properties of soy foods have been attributed to soy isoflavones.9,32 These have structural similarity to 17-β-estradiol,33,34 and may either act as weak estrogens33,34 or block endogenous estrogens.33,35 Isoflavones may also have antiproliferative effects and antioxidant activity,34 and enhance DNA repair systems.36 Other epidemiological studies have evaluated associations between intakes of soy, and dairy, and risk of breast cancer. Cohort studies in Asian populations suggest decreased breast cancer risk with higher (10–20 mg/d) intake of isoflavones,37–39 but a review reports that null findings characterize most studies of Western populations where intake of isoflavones is generally very low (1–2 mg/d).40 This includes a US cohort study of higher-consuming Japanese American women.41 Inconsistent results prevent clear conclusions,42 and dairy was usually not included in these analyses.
Dairy constituents could hypothetically cause both beneficial effects (conjugated linoleic acid, and lactoferrin) or harmful effects (bovine sex hormones, dairy protein-mediated increases in serum IGF-1).10 Studies of dairy intake have reported protective (cohort studies),43–45 null (cohort studies),46–49 or hazardous (one cohort, one large case-control study)50,51 associations with breast cancer. Effects of dietary calcium are poorly understood,52,53 and cohort studies have mostly shown protective43,44,46,54,55 or null47,56–59 associations with risk, this including results from a randomized trial.58
Our results raise the possibility that some previous findings37–39 of a lower incidence of breast cancer risk among higher soy consumers may be at least partially due to a relative absence of dairy. Soy appeared to be possibly protective in our data until adjustment (and appropriate non-linear modelling) for dairy, indicating important confounding. That dairy has inconsistently had a mildly protective association in some populations43–45 may be due to confounding, as other studies have not adjusted for non-dairy substitute foods. It may also be due to measurement error, which has more influence when the range of intakes is low.60 The slope of the association was stronger at relatively low intakes in AHS-2, an intake region not so well represented in most other studies.
A hazardous effect of dairy is consistent with the recent AHS-2 report suggesting that vegans but not lacto-ovo-vegetarians experienced less breast cancer than non-vegetarians.61 Others have speculated that dairy is implicated in the marked increases in breast cancer in Japan since the Second World War, associated with a 20-fold increase in dairy consumption.10 These Japanese results may be the only other comparison between essentially zero intakes and much higher intakes, aside from the AHS-2 data. Other international comparisons also find strong ecological correlations between dairy intake and rates of breast cancer.62
Bovine sex hormones10,62,63 and endogenous serum IGF-1 levels10,64 are two possible mediating agents in a dairy milk breast cancer link. About 75% of dairy cows providing milk in modern dairy production are pregnant, and by definition are lactating. Hence several estrogen variants (ng/L) and progesterone (µg/L) can be found in cows’ milk.65–68 Progesterone concentrations are strongly positively correlated with fat content of the milk and stage of gestation.69 However, our analyses found no association between risk and milk fat content.
The estrogen and progesterone levels in milk appear to be small compared with female endogenous production and have been claimed to be biologically unimportant.65,66 Nevertheless: low-fat milk and whole milk promote mammary tumour growth in rats70; changing from a no-dairy to a dairy diet increases estrogen levels in South African Black males71; milk consumption increases urinary excretion and serum levels of estradiol72; milk consumption may also have effects on sperm motility and normal morphology in young men73; and intake of low-fat dairy products may delay age of menopause.63 Some of these effects could result from endogenous conversion of dairy estrone (or other conjugated variants) and progesterone to estradiol.68,69
Estrogens and progesterone (progestins) influence breast development. Prospective observational studies and a randomized trial observed an increased risk of breast cancer in those taking these hormones as post-menopausal hormone replacement therapy.74–76 In our data, associations between dairy and risk of breast cancer were positive and were not convincingly different among hormone receptor cancer subtypes. The non-linear positive association that we find for dairy milk, if causal, could indicate that a pathway becomes relatively saturated at around 2/3 of an 8 ounce cup of milk each day. Substantially lower hormone levels are reported in cheese and yogurt (per gram of these foods),77 perhaps due to ageing in the case of cheese. Products with lower intakes (e.g. yogurt) may have lower magnitude associations, comparing extreme intakes, and thus also lower statistical power to reveal true associations.
Milk contains bovine IGF-1 which is absorbed and is not destroyed by pasteurization.10 Moreover intake of milk has also been associated with higher levels of endogenous IGF-1,64 a proliferative hormone that is a probable causal factor in breast cancer.78
Weaknesses of this study are its observational design and possible residual confounding between dairy and unmeasured factors, despite extensive covariate adjustment. Diet was measured only once at study baseline. Dietary measurement errors are inevitable, despite the relatively good validity of relevant dietary factors in AHS-2. However, 95% CIs of calibrated (measurement error-corrected) analyses also exclude the null, confirming a statistically significant association of greater magnitude than uncorrected results. Whether these results can be applied to other populations is unknown, but there is little reason to suspect that American Adventists have different biological responses than others. Strengths are the relatively large population where most had adhered to their dietary groups for at least a decade,79 and the relatively large numbers of low- and non-dairy consumers, the intake region where the slope of association with breast cancer was greatest. Nevertheless, causality specifically attributable to dairy products is not proven by this work, but deserves further consideration.
In conclusion, we observe a potentially important positive association between dairy (especially milk) consumption and risk of breast cancer. Comparing medians of extreme dairy milk intake quintiles, risk at the higher intake was greater by 50% (uncalibrated analyses) and more than doubled in calibrated analyses. There was an especially strong rise in risk up to 2/3 of an 8 ounce cup of milk (about 100 kcals of full-fat milk) per day, possibly less easy to demonstrate in other populations where fewer subjects consume dairy in this relatively low intake range. Hence, data from this US Adventist, but otherwise diverse, population, suggest that either dairy milk or some closely-related unidentified factor(s) increases the risk of breast cancer.
Supplementary data
Supplementary data are available at IJE online.
Funding
This study was supported by the National Cancer Institute at the National Institutes of Health (grant 1UO1CA152939; and the World Cancer Research Fund (U.K.) (grant 2009/93). The funding agencies had no role in the design, analysis or writing of this article.
Acknowledgements
We acknowledge the contributions of the AHS-2 participants, Hanni Bennett, Sonja Hall, Barbara Burton and Lars Sveen, for their work with the baseline questionnaire data, the calibration sub-study data and data management. Cancer incidence data were provided by the: Alabama State Cancer Registry, Alaska Cancer Registry, Arizona Cancer Registry, Arkansas Cancer Registry, California Cancer Registry, Colorado Cancer Registry, Connecticut Tumor Registry, District of Columbia Cancer Registry, Delaware Cancer Registry, Florida Cancer Data System, Georgia Department of Public Health, Hawaii Tumor Registry, Cancer Data Registry of Idaho, Illinois State Cancer Registry, Indiana State Cancer Registry, Iowa Cancer Registry, Kansas Cancer Registry, Kentucky Cancer Registry, Louisiana Tumor Registry, Maryland Cancer Registry, Massachusetts Cancer Registry, Michigan Cancer Surveillance System, Minnesota Cancer Surveillance System, Mississippi Cancer Registry, Missouri Cancer Registry and Research Center, Montana Central Tumor Registry, Nebraska Cancer Registry, Nevada Central Cancer Registry, New Hampshire State Cancer Registry, New Jersey State Cancer Registry, New Mexico Tumor Registry, New York State Cancer Registry, North Carolina Central Cancer Registry, North Dakota Statewide Cancer Registry, Cancer Data Registry of Ohio, Oklahoma, Central Cancer Registry, Oregon State Cancer Registry, Pennsylvania Cancer Registry, Rhode Island Cancer Registry, South Carolina Cancer Registry, South Dakota Cancer Registry, Tennessee Cancer Registry, Texas Cancer Registry, Utah Cancer Registry (NCI contract HHSN261201300071), Vermont Cancer Registry, Virginia Cancer Registry, Washington State Cancer Registry, West Virginia Cancer Registry, Wisconsin Cancer Reporting System and Wyoming Cancer Surveillance Program.
Conflict of Interest: Three of the authors are largely vegetarian, but all authors regularly and freely use dairy products with no religious or other restrictions. None has any association with the soy product or dairy industries.
References
American Cancer Society.
World Cancer Research Fund/American Institute for Cancer Research.
Collaborative Group on Hormonal Factors in Breast Cancer.
World Cancer Research Fund International. American Institute for Cancer Research. Continuous Update Report: Diet, Nutrition, Physical Activity and Breast Cancer. London: World Cancer Research Fund International,
U.S. Department of Health and Human Services and U.S. Department of Agriculture. 2015–2020 Dietary Guidelines for Americans, 8th edn. Washington, DC: U.S. Department of Health and Human Services and U.S. Department of Agriculture,
U.S. Centers for Medicare & Medicaid Services. 2014 ICD-10-CM and GEMs. 2014. https//www.cms.gov/medicare/coding/icd10/2014-icd-10cm-and-gems.html (26 March 2018, date last accessed).

