


Abstract
Hypnosis has proven clinical utility, yet changes in brain activity underlying the hypnotic state have not yet been fully identified. Previous research suggests that hypnosis is associated with decreased default mode network (DMN) activity and that high hypnotizability is associated with greater functional connectivity between the executive control network (ECN) and the salience network (SN). We used functional magnetic resonance imaging to investigate activity and functional connectivity among these three networks in hypnosis. We selected 57 of 545 healthy subjects with very high or low hypnotizability using two hypnotizability scales. All subjects underwent four conditions in the scanner: rest, memory retrieval, and two different hypnosis experiences guided by standard pre-recorded instructions in counterbalanced order. Seeds for the ECN, SN, and DMN were left and right dorsolateral prefrontal cortex, dorsal anterior cingulate cortex (dACC), and posterior cingulate cortex (PCC), respectively. During hypnosis there was reduced activity in the dACC, increased functional connectivity between the dorsolateral prefrontal cortex (DLPFC;ECN) and the insula in the SN, and reduced connectivity between the ECN (DLPFC) and the DMN (PCC). These changes in neural activity underlie the focused attention, enhanced somatic and emotional control, and lack of self-consciousness that characterizes hypnosis.
Introduction
Hypnosis was the first Western form of psychotherapy. It involves highly focused attention, referred to as absorption (Tellegen and Atkinson 1974), coupled with dissociation, the compartmentalization of experience (Elkins et al. 2015), and suggestibility, nonjudgmental behavioral responsiveness to instructions from others (Spiegel H and Spiegel D 2004). Hypnosis is an effective adjunct to the treatment of pain, anxiety, psychosomatic, post-traumatic, and dissociative disorders (Spiegel and Bloom 1983; Colgan et al. 1988; Brom et al. 1989; Lang et al. 2000; Barry and Sanborn 2001; Bhuvaneswar and Spiegel 2013; Spiegel 2013; Tefikow et al. 2013; Adachi et al. 2014; Schaefert et al. 2014).
Resting-state functional magnetic resonance imaging (fMRI) analysis has recently been employed to understand brain effects underlying hypnosis and differences between high and low hypnotizables. Specifically, functional connectivity among three brain networks: the executive control network (ECN), salience network (SN), and default mode networks (DMNs) have been examined. The ECN comprises bilateral dorsolateral prefrontal cortex (DLPFC) and superior parietal cortices and is involved during focused attention and working memory tasks (Seeley et al. 2007). Like the ECN, the SN is activated during tasks; it joins the dorsal anterior cingulate cortex (dACC) and frontoinsular cortex to subcortical regions like the hypothalamus. It is typically activated when one is challenged or anxious (Seeley et al. 2007). The DMN is composed of a set of structures including the posterior cingulate cortex (PCC) and other midline brain structures including the medial prefrontal cortex (mPFC), which are activated and become highly interconnected during rest and rumination and deactivated as task engagement increases (Seeley et al. 2007; Supekar et al. 2008; Greicius et al. 2009).
There are recent data indicating differences in fMRI functional connectivity between individuals who are high and low in hypnotizability, a measurable (Spiegel H and Spiegel D 2004) and stable trait throughout adulthood (0.7 test–retest correlation over 25 years) (Piccione et al. 1989). Decreased DMN activity has been reported in high hypnotizables during hypnosis (McGeown et al. 2009; Deeley et al. 2012), indicating that hypnosis is a state of awareness distinct from the resting state. (Hoeft et al. 2012) found increased connectivity of the left anterior aspects of the DLPFC of the ECN and the dACC of the SN in high hypnotizables compared with lows at rest, identifying the trait rather than the state. Additionally, there is evidence that hypnotizability is associated with higher levels of the dopamine metabolite homovanillic acid in the cerebrospinal fluid (CSF) (Spiegel and King 1992). These findings led us to expect that high hypnotizables would exhibit increases in functional connectivity between the dopamine-rich DLPFC and dACC during the hypnotic state (Vrieze et al. 2013), reflecting greater top-down sensory control. Furthermore, prior work has shown that the degree of pain experienced by subjects when told under hypnosis that they will experience pain is positively correlated with DLPFC, dACC, and insular activation (Raij et al. 2009). Conversely, hypnotic analgesia specifically directed at pain affect (“the pain will not bother you”) is associated with reduced activity in the dACC (Rainville et al. 1997). These findings additionally suggest that dACC deactivation during hypnosis is task-dependent, with decrements in activation related to decreased negative affect. This is consistent with previous work showing that dACC activation is associated with appraisal and expression of fear and pain (Etkin et al. 2011), as well as a sense of personal agency or will to persevere (Parvizi et al. 2013). Hypnotic analgesia may thus involve a reciprocal interaction of cognitive reinterpretation of the meaning of pain sensation in response to suggestion (DLPFC) and reduced negative affect about it (dACC). However, in one hypnotic paralysis study, the hypnotic state was found to be associated with an increase in right ACC activity, as well as that in the orbitofrontal cortex bilaterally (Cojan et al. 2009). Greater functional connectivity between the SN and ECN would amplify task-related activity reflecting increases or decreases in anxiety.
There has been debate regarding whether hypnosis is a distinct neurophysiological state or simply the product of expectation and social influence (Sadler and Woody 2006; Mazzoni et al. 2013). The sociocognitive approach emphasizes the importance of expectancy, especially involving the use of the word “hypnosis,” and sees hypnotic experiences on a continuum of social influence on cognition and behavior, rather than as reflecting a change in neural or mental state (Lynn et al. 2015a,b). When subjects are simply told to enter hypnosis with no further instructions, low hypnotizables focus on everyday concerns while high hypnotizables experience imagery or positive affect/exceptional experiences (Cardena et al. 2013).
This study was designed to identify differences in resting-state brain activity (i.e. connectivity of the EC, SN, and DMN) between highly hypnotizable and low hypnotizable individuals during hypnosis. Specifically, we hypothesized a priori that highly hypnotizable subjects, relative to low hypnotizables, when hypnotized, would show: 1) decreased activity in the dACC; 2) increased connectivity between ECN regions such as the DLPFC and SN attentional control regions, such as the frontoinsular cortex and the dACC; 3) decreased connectivity in brain regions mediating self-referential processing, such as the MPFC and PCC (i.e. DMN).
Methods and Materials
Experimental Procedures
Subjects
The study was approved by Stanford's Institutional Review Board. Consent forms for participation in initial screening and fMRI scanning were provided by trained research assistants and the PI's contact information was provided. There were no complaints or concerns expressed about research procedures. We screened 545 healthy participants recruited in college and university settings for hypnotizability using total scores on the Harvard Group Scale for Hypnotic Susceptibility, Form A (HGSHS:A) (Shor and Orne 1962), and confirmed those rated low and high in hypnotizability with blinded individual administration of the hypnotic induction profile (HIP) (Stern et al. 1978; Spiegel H and Spiegel D 2004). Both measures involve a formal hypnotic induction followed by a series of instructions for alterations in sensory, motor, and volitional function. Both have acceptable test–retest reliability and inter-rater agreement. Evidence for validity includes significant correlations between scores on these tests and clinical response to treatments involving hypnosis for pain (Hilgard and Hilgard 1975), smoking (Spiegel et al. 1993), and phobias (Spiegel et al. 1981). Participants were included in the initial high hypnotizable group (“highs”) if they scored between 9–12 on HGSHS:A (range 0–12) screening and 7–10 on a subsequent individual HIP (Spiegel H and Spiegel D 2004) (range 0–10). Participants were included in the minimally hypnotizable group (“lows”) if they scored between 0–3 on the Harvard Group scale and 0–3 on a subsequent HIP. This left 67 subjects (43 confirmed highs and 24 confirmed lows) to participate in the fMRI portion of the study. Subjects were excluded if they reported any history of or current: 1) significant head trauma or other neurologic disorder such as stroke, seizure, or multiple sclerosis; 2) active substance abuse; 3) psychiatric diagnosis or current use of psychotropic medication; 4) pregnancy or nursing; and 5) fMRI scanning contraindication such as an implanted device. Data from 7 highs and 3 lows were discarded (1 had a permanent metal retainer, 3 had excess head movement during the scan, 2 were bothered by the scanner noise, and 4 others because of technical scanner problems, failure to experience hypnosis in the scanner, or an incomplete scan). Ultimately, 36 highs and 21 lows who scored consistently high or low on both measures, representing 10.5% of the sample screened, participated in the brain imaging studies (Table 1). All subjects were asked to rate on a scale of 1–10 how hypnotized they felt during each of the two hypnotic scans, with one indicating “not hypnotized at all” and 10 representing “deeply hypnotized.” These two ratings were highly correlated across the 36 highs (r = 0.69, P < 0.001). We selected the subjects in the “high” group with the top 21 highest mean ratings to match the sample size of the lows for between-group fMRI analyses. For one-sample comparisons among highs using the intensity of hypnosis ratings as a covariate of interest, scans from all 36 highs were used. This provided a manipulation check to see whether those with hypnotic capacity who experienced a more profound hypnotic response had greater associated brain activity and connectivity changes. Between the 21 highs and 21 lows, independent two-sample t-tests showed that hypnotizability scores (HIP: t = 17.4, P < 0.0001; HGS: t = 24.0, P < 0.001) and post-scan ratings (t = 12.50, P < 0.0001) differed significantly as planned, while age (t = 1.58, P = 0.12) and gender (χ2 = 0.89, P = 0.35) did not (Table 1). Between the 21 highs selected and the 15 remaining highs, independent two-sample t-tests showed that hypnotizability scores (HIP: t = 0.95, P = 0.35; HGS: t = 1.25, P = 0.22) did not differ significantly, but, as planned, post-scan ratings did (t = 8.87, P < 0.0001).
Study subjects. Of 545 participants screened for hypnotizability using the Harvard Group Scale for Hypnotic Susceptibility, Form A (HGSHS:A (Shor and Orne 1962), 36 highs and 21 lows who scored consistently on that and the HIP (Spiegel 2004; Spiegel and Spiegel,2004) were scanned. The High Subgroup was selected for having the highest self-ratings of intensity of hypnotic experience during the hypnosis tasks in the study
| Hypnotizability | High (36) | High subgroup (21) | Low (21) |
|---|---|---|---|
| Age | 23.8 ± 10.5 | 21.7 ± 8.5 | 26.5 ± 10.9 |
| Gender (M/F) | 12/25 | 7/13 | 10/10 |
| Post-scan hypnosis ratings (1–10) | 7 ± 1.8 | 8.3 ± 0.6 | 2.4 ± 2 |
| HIP (0–10) | 8.5 ± 0.9 | 8.7 ± 1.0 | 1.9 ± 1.4 |
| HGSHS (0–12) | 9.7 ± 1.3 | 9.95 ± 1.4 | 1.4 ± 1.0 |
Hypnosis Conditions
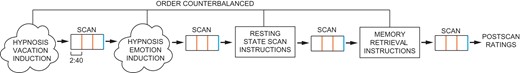
All subjects were scanned during 4 conditions administered in counterbalanced order: 1) hypnotic happiness (hypnotic emotion condition), 2) hypnotic vacation (hypnotic memory condition), 3) resting state, and 4) memory condition (Fig. 1). Before each scan, subjects were given pre-recorded instructions to stay still and close their eyes. Depending on the condition, subjects were then instructed with a pre-recorded script lasting 1–2 min to either let their minds wander and think about nothing in particular (resting-state scan), think about their day in great detail (memory control scan), or to enter into a hypnotic state via a brief 2 min hypnotic induction script used in clinical care (Spiegel H and Spiegel D 2004). Subjects were hypnotized with an instruction to look up and close their eyes, take a deep breath, let the breath out, and let their body float, as though they were in a bath, a lake, a hot tub, or floating in space. In one hypnotic condition participants were instructed to imagine a time when they felt happiness, and in another to remember or imagine a vacation. We chose to structure the content of the two hypnosis conditions rather than simply provide an hypnotic induction with no further guidance. These hypnotic induction variants controlled for the tendency of people with different levels of hypnotizability to focus spontaneously on different mental content when hypnotized without further instruction: low hypnotizables focus on everyday concerns, while high hypnotizables experience imagery or positive affect/exceptional experiences (Cardena et al. 2013). Any differences observed could be attributed to differences in the mental content rather than the state of hypnosis. Our 2 × 2 design (high vs. low hypnotizabilty, hypnosis vs. control conditions) tested for fMRI differences observed only among highs and only in the two hypnosis conditions compared to rest and memory without hypnosis, to control for the role of memory processing during hypnosis conditions.
Experimental design. Four scans were performed in counterbalanced order for each subject (hypnosis conditions, rest, memory). All 4 scans were performed within one session, with each scan preceded directly by either instructions (rest, memory scans) or induction (hypnosis scans). Orange bars indicate timing of instruction/induction reminders during each scan, and blue bar indicates within-scan ratings. Subjects provided post-scan ratings immediately following the entire session.
The hypnotic tasks were also designed to maintain adherence, e.g. continuous use of the hypnotic experience analogous to clinical applications of hypnosis in treatment. In addition, participants were reminded via pre-recorded scripts during all scans to continue the particular instructed task 1/3rd and 2/3rd of the way into the scan. These reminders repeated part of the directions for each condition. As a manipulation check, at the end of each condition subjects rated how hypnotized (or drowsy, in the rest and autobiographical memory scans) they felt on a scale of 1–4 using a button box. A recording ended hypnosis at the end of each hypnosis condition, and then participants were asked to provide hypnotic intensity ratings again, this time on a 1–10 scale. We controlled for variability in social input by using standardized recordings of hypnotic instructions during the experiment, and for expectancy by having subjects rate the intensity of their hypnotic experience.
fMRI Scanning
Data acquisition
Subjects underwent four 8-min scans, followed by a 10-min structural scan. Magnetic resonance imaging was performed on a 3.0 T GE whole-body scanner (GE Healthcare Systems, Milwaukee, WI) located at the Lucas Center for Imaging at Stanford University School of Medicine using an eight-channel head coil. High-resolution structural scans were acquired using a spoiled GRASS sequence (128 slices, 0.86-mm2 in-plane and 1.2-mm through-plane resolution, flip angle = 11°, FOV = 22 cm), facilitating subsequent localization and coregistration of functional data. A T2*-sensitive gradient echo spiral-in/out pulse sequence (Glover and Law 2001) was used for functional imaging (TR = 2000 ms, TE = 30 ms, flip angle = 80°, matrix 64 × 64, FOV = 22 cm). Thirty-one oblique axial slices were obtained parallel to the AC-PC with 4-mm slice thickness, 1-mm skip. A high-order shimming procedure was used to reduce B0 heterogeneity before the functional scan (Kim et al. 2002). Cardiac signals were collected via photoplethysmograph and respiration monitored by a respiratory belt around the abdomen within the scanner.
Data preprocessing
Images were preprocessed and analyzed using FMRIB's Software Library (FSL version 4.1) (Smith et al. 2004). Physiological signals were first removed using RETROICOR and RVHRCOR (Glover et al. 2000; Chang and Glover 2009). The first 6 of 240 volumes were discarded to allow for signal stabilization, resulting in 234 volumes. The following preprocessing steps were then applied: motion correction using least square minimization (Jenkinson et al. 2002), removal of non-brain structures (Smith et al. 2002), resampling to 2 mm and spatial smoothing with a 6 mm full-width at half-maximum Gaussian kernel, mean-based intensity normalization of all volumes by the same factor, and high-pass filtering with a Gaussian-weighted least-squares straight line fitting (sigma = 75 s). For the fractional amplitude of low-frequency fluctuation (fALFF) analysis described below, data were not high-passed, but all other steps were identical. Functional scans were then aligned to each individual's high-resolution T1-weighted image and registered to the MNI152 standard space using affine linear registration (Jenkinson et al. 2002). Several sources of noise were subsequently regressed out of the 4D images, including variance from CSF, white matter, and the 6 standard movement parameters. Time-series for CSF and white matter were calculated using 3 mm spherical ROIs centered at coordinates x = 18, y = −34, z = 18 in the CSF of the MNI152 standard atlas space and x = 26, y = −12, z = 34 of white matter (Shirer et al. 2012).
Movement and physiological parameters were calculated for each group (Table S1). A 2 × 4 mixed ANOVA (group by condition) showed no significant effects of heart rate on group, condition or interaction of group and condition (group: F(1,40) = 0.51, P = 0.48; condition: F(3,40) = 1.54, P = 0.21; group by condition: F(3,40) = 1.36, P = 0.26). For respiration rate, there was a significant main effect on condition (F(3,40) = 16.24, P < 0.001) but no significant main effect on group (F(1,40) = 0.04, P = 0.84) or group by condition interaction (F(3,40) = 1.23, P = 0.30). Post-hoc paired sample t-tests showed that respiration rate was significantly higher during the memory scan than during rest (t(40) = 4.14, P < 0.001), vacation (t(40) = 6.24, P < 0.001), and happy (t(40) = 5.45, P < 0.001), and significantly higher during rest compared to vacation (t(40) = 2.33, P = 0.02) and happy (t(40) = 2.37, P = 0.02). Next, we found no significant effects of movement (mean absolute displacement) on group, condition, or interactions of group and condition (group: F(1,40) = 2.27, P = 0.14; condition: F(3,40) = 0.44, P = 0.72; group by condition: F(3,40) = 0.69, P = 0.55). Additionally we examined mean framewise displacement (Power et al. 2012) and found no main effect of group (F(1,40) = 0.01, P = 0.92), condition (F(3,40) = 1.01, P = 0.39), or group by condition interaction (F(3,40) = 1.49, P = 0.22). Finally there were no significant effects of percent frames scrubbed using a threshold of 0.5 mm (Power et al. 2012) on group, condition, or interactions of group and condition (group: F(1,40) = 0.56, P = 0.46; condition: F(3,40) = 0.27, P = 0.85; group by condition: F(3,40) = 1.65, P = 0.18).
Data Analysis
Fractional Amplitude of Low-Frequency Fluctuations
We utilized the fALFF of the fMRI signal to measure the amplitude of regional spontaneous activity throughout the brain (Zou et al. 2008). It is a ratio of the power spectrum of low frequency (0.01–0.08 Hz) to that of the entire frequency range, thereby controlling for overall physiological noise. We made group by condition comparisons using non-parametric t-tests with “Threshold-Free Cluster Enhancement” (TFCE) (Smith and Nichols 2009). The fALFF analysis was performed using the resting-state fMRI data analysis toolkit (REST) version 1.6 (Song et al. 2011). To examine differences in fALFF across states, a fixed effects analysis was performed voxel-wise at the level of single subject fALFF maps to yield subject-specific maps of the contrast of interest—the averaged fALFF of the two hypnotic conditions minus rest and memory minus rest. These maps were used as input for group-level analyses using FSL's non-parametric statistical method (randomize) (Smith et al. 2004).
Functional Connectivity Analysis
To compare within network and across network connectivity for ECN, SN, and DMN, seeds were taken from left and right DLPFC, dACC, and PCC as central nodes of the respective networks. All four seed regions were derived from a previously reported resting-state study (Shirer et al. 2012). No mask was applied. For each subject and each condition, averaged time-series within these ROIs were used as regressors of interest against the global signal time-series in a multiple regression analysis using FSL's FEAT tool (Smith et al. 2004). For seeds in which between-group comparisons were significant, intensity of hypnosis ratings for all 36 highs were used as a covariate of interest in a separate analysis to examine where hypnotic experience varied with connectivity to seed, similar to the method of (Deeley et al. 2012). We chose this approach since by design the two groups were at the extremes of the hypnotizability continuum, so within-group variance among those capable of experiencing hypnosis is more meaningful and consistent with statistical assumptions.
To test the interaction of interest (hypnosis conditions−rest) and the control contrast (memory−rest), a fixed effects analysis was performed voxel-wise for connectivity maps to yield subject-specific maps of hypnosis−rest (beta values for the two hypnosis conditions were averaged after regression for each subject) and memory−rest maps. These maps then were used in group-level analyses via FLAME, a mixed-effects model in FSL (Smith et al. 2004) and corrections for multiple comparisons were carried out at the cluster level using Gaussian random field theory (GRF) (z > 2.3; cluster significance: P < 0.05).
Results
Decreased dACC Activity During Hypnosis
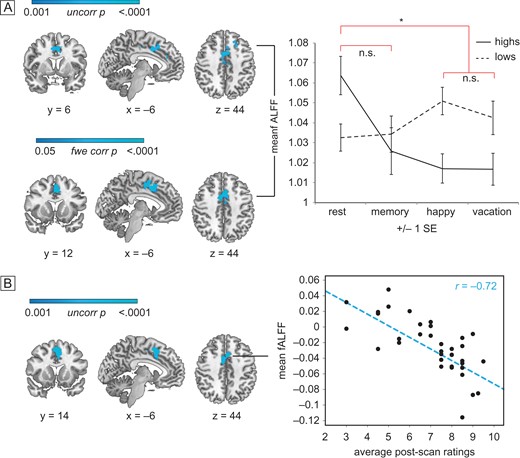
We found that during hypnosis among high hypnotizables there was reduced activity in the dACC, as measured by the fALFFs in the fMRI BOLD signal. In a group-level analysis of hypnosis versus rest throughout the brain, sample-matched high hypnotizables exhibited reduced regional fractional amplitude of BOLD signal only in the dACC, as well as the left superior frontal gyrus during hypnosis relative to rest (TFCE, P < 0.05 family wise error corrected, Fig. 2A, Table 2) in comparisonwith lows in those conditions.
Brain regions showing significant group differences in fALFFs
| Comparison | Contrast | Peak | Side | Cluster size | x | y | z | T | P |
|---|---|---|---|---|---|---|---|---|---|
| 21 High > Low | Hypnosis < Rest | Anterior cingulate gyrus | L/R | 469 | 8 | 14 | 24 | 3.08* | 0.0002 |
| Superior frontal gyrus | L | 126 | −16 | 28 | 40 | 3.04* | 0.0002 | ||
| Anterior cingulate gyrus | L/R | 74 | −8 | 36 | 24 | 3.37* | 0.0002 | ||
| Hypnosis < Memory < Rest | Anterior cingulate gyrus | L/R | 226 | −6 | 12 | 36 | 3.41* | 0.0002 | |
| Superior frontal gyrus | L | 93 | −20 | 22 | 42 | 3.50* | 0.0002 | ||
| Anterior cingulate gyrus | L/R | 32 | 10 | 20 | 26 | 2.81* | 0.0002 | ||
| 21 High | Hypnosis < Rest | Anterior cingulate/paracingulate gyrus | L/R | 670 | −2 | 14 | 46 | 6.02** | 0.0030 |
| Hypnosis < Memory < Rest | Anterior cingulate/paracingulate gyrus | L/R | 511 | 6 | 2 | 40 | 7.77** | 0.0040 | |
| 36 High (+ covaried with ratings) | Hypnosis < Rest | Anterior cingulate gyrus | L/R | 878 | −4 | 14 | 34 | 3.00* | 0.0002 |
| Hypnosis < Memory < Rest | Anterior cingulate gyrus | L/R | 652 | −4 | 12 | 34 | 3.15* | 0.0002 |
Note: *Peaks derived from raw t scores masked with TFCE, P < 0.001 uncorrected images.
**Peaks derived from raw t scores masked with TFCE, P < 0.05 FWE corrected maps.
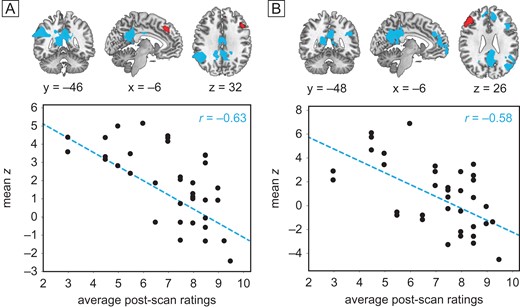
fALFF activity in the dACC. Group (high vs. low hypnotizable) by condition (rest/memory vs. hypnosis in random order) differences in dACC activity. Images are displayed in radiologic convention: the left side of the image corresponds to the right side of the brain. (A) Group by condition interaction (upper panel): blue regions show an interaction between group (high vs. low) and condition (hypnosis vs. rest). The interaction is N.S. for memory relative to rest at the same threshold. The two hypnosis conditions do not show significantly different fALFF. Mean z scores extracted from significant dACC cluster are plotted across group and condition (right panel). Hypnosis versus rest within highs (lower panel): blue regions confirm significantly decreased fractional amplitude during hypnosis relative to rest only for highs. The effect is not significant for memory relative to rest at the same threshold. (B) Hypnotic response scores correlate with fALFF: blue regions show decreasing fractional amplitude during hypnosis relative to rest as post-scan intensity of hypnosis ratings increases, among all 36 highs. Scatterplot shows individual mean z scores extracted from the significant dACC region against individual mean intensity of hypnosis ratings.
On the basis of this finding we conducted confirmatory secondary analyses. The interaction between highs and lows was significant at P < 0.001, uncorrected for multiple comparisons. All dACC regions showed lower activity during hypnosis compared to rest among the highs. There were no such differences among regions within lows across conditions or in the control memory–rest contrast. We also secondarily examined voxel-wise the relationship of fALFF to reported intensity of hypnosis among all 36 highs. Those who reported they felt more hypnotized had the lowest ratio of fALFF in the dACC during hypnosis relative to rest using TFCE, P < 0.001. Though this result is uncorrected for multiple comparisons (Fig. 2B, Table 2), no other regions were significantly positively or negatively correlated with ratings at the same threshold throughout the rest of the brain. Additionally, the degree of fALFF reduction was related linearly to engagement with task; highs exhibited reduced dACC fALFF during hypnosis compared to memory, and less during memory compared to rest, whereas lows showed the opposite pattern (Fig. 2, Table 2).
Differences in Functional Connectivity During Hypnosis
Coupling of ECN and SN
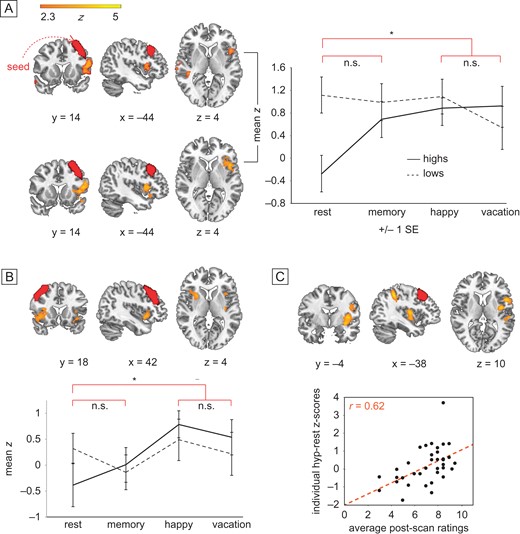
In between-group analysis using functionally defined ROIs (Shirer et al. 2012) based upon our a priori hypotheses, the left DLPFC displayed significantly enhanced connectivity to ipsilateral insular cortex and contralateral supramarginal gyrus in highs compared to lows during hypnosis compared to rest (P < 0.05, corrected for multiple comparisons with FEAT's GRF correction; Fig. 3A; Table 3). The sameinteraction was not significant after multiple comparisons correction between right DLPFC and ipsilateral insula. Within-group analysis comparing hypnosis to rest confirmed that highs showed significantly elevated coupling between left DLPFC and ipsilateral insula during hypnosis compared to rest at P < 0.05, GRF corrected (Fig. 3A, Table 3). Highs also displayed significantly greater connectivity between right DLPFC and both left and right insula during hypnosis compared to rest at P < 0.05, GRF corrected (Fig. 3B, Table 3). For lows, there were no significant differences for the hypnosis-rest contrast with either DLPFC seed. Overall highs showed more variability in functional connectivity across conditions than did lows, but started from lower resting connectivity between DLPFC and insula.
Brain regions showing significant group differences in seed-based functional connectivity
| Seed | Group | Contrast | Peak | Side | Cluster size | x | y | z | Z | P |
|---|---|---|---|---|---|---|---|---|---|---|
| Left DLPFC | 21 High > Low | Hypnosis > Rest | Inferior frontal gyrus/insula | L | 807 | −56 | 18 | 16 | 3.75 | 0.0118 |
| Supramarginal gyrus | R | 736 | 48 | −44 | 18 | 3.37 | 0.0193 | |||
| Hypnosis > Memory > Rest | Inferior frontal gyrus/insula | L | 1040 | −54 | 14 | 14 | 3.75 | 0.0026 | ||
| Rest | Lateral occipital cortex | L | 788 | −54 | −70 | 14 | 3.88 | 0.0264 | ||
| 21 High | Hypnosis > Rest | insula/inferior frontal gyrus | L | 1047 | −52 | 12 | 12 | 4.6 | 0.0025 | |
| Hypnosis > Memory > Rest | Inferior frontal gyrus/insula | L | 966 | −54 | 12 | 12 | 3.78 | 0.0042 | ||
| 36 High (+ covaried with ratings) | Hypnosis > Rest | Middle frontal gyrus | L | 1740 | −56 | 12 | 24 | 5.15 | <0.0001 | |
| Superior parietal lobule | L | 1699 | −40 | −40 | 46 | 4.57 | <0.0001 | |||
| Memory > Rest | Middle frontal gyrus | L | 926 | −46 | −2 | 28 | 3.96 | 0.0058 | ||
| Lateral occipital cortex | L | 813 | −28 | −68 | 32 | 3.65 | 0.0126 | |||
| Hypnosis > Memory > Rest | Superior parietal lobule | L | 1602 | −40 | −40 | 46 | 4.42 | 0.0001 | ||
| Insular cortex | L | 1053 | −34 | −4 | −6 | 4.19 | 0.0027 | |||
| Superior frontal gyrus | L/R | 947 | 14 | −4 | 60 | 3.38 | 0.0053 | |||
| Inferior frontal gyrus | L | 895 | −58 | 20 | 16 | 4.27 | 0.0074 | |||
| Inferior frontal gyrus | R | 831 | 54 | 18 | 20 | 3.64 | 0.0115 | |||
| Precentral gyrus | L | 626 | −26 | −12 | 42 | 3.49 | 0.0494 | |||
| 36 High (− covaried with ratings) | Hypnosis (vacation + happy) | Posterior cingulate gyrus | L/R | 2249 | −4 | −46 | 30 | 4.16 | <0.0001 | |
| Angular gyrus | R | 1187 | 44 | −52 | 34 | 4.16 | 0.0024 | |||
| Temporal pole | L | 759 | −46 | 14 | −36 | 4.37 | 0.0312 | |||
| Right DLPFC | 21 High > Low | Memory > Rest | Superior frontal gyrus/ paracingulate gyrus | L/R | 1182 | 6 | 26 | 56 | 4.89 | 0.0011 |
| Frontal operculum/insula | L | 808 | −46 | 22 | 0 | 4.09 | 0.0120 | |||
| Rest | Lateral occipital cortex/angular gyrus | L | 869 | −38 | −74 | 40 | 3.78 | 0.0209 | ||
| Hypnosis | Lateral occipital cortex/angular gyrus | L | 1213 | −36 | −74 | 34 | 3.6 | 0.0033 | ||
| 21 High | Hypnosis > Rest | Insular cortex | R | 939 | 28 | 14 | 0 | 3.78 | 0.0054 | |
| Insular cortex | L | 725 | −38 | −8 | −4 | 3.48 | 0.0223 | |||
| Central opercular cortex | R | 652 | 50 | −16 | 18 | 3.77 | 0.0374 | |||
| Hypnosis > Memory > Rest | Insular cortex | R | 3433 | 40 | −6 | −8 | 4.36 | <0.0001 | ||
| Insular cortex | L | 1789 | −36 | −18 | 0 | 3.70 | <0.0001 | |||
| 36 High (− covaried with ratings) | Hypnosis | posterior cingulate gyrus | L/R | 2223 | −4 | −44 | 28 | 4.75 | <0.0001 | |
| Superior frontal/ paracingulate | L/R | 1997 | −12 | 24 | 52 | 4.04 | <0.0001 | |||
| Superior lateral occipital cortex | L | 1624 | −60 | −78 | 28 | 4.14 | <0.0001 | |||
| Memory | Subcallosal cortex | L | 818 | −6 | 10 | −12 | 3.84 | 0.0315 | ||
| Seed to region of interest (ROI) comparisons | ||||||||||
| dACC | 21 High > Low | Rest | DLPFC ROI (Hoeft et al., 2012) | L | 191 | −38 | 42 | 26 | 2.94 | 0.0054 |
| DLPFC ROI (Shirer et al., 2012) | L | 1501 | −30 | 23 | 48 | −1.43 | 0.1614 | |||
Group (high vs. low) by condition (hypnosis vs. rest/memory in random order) differences in functional connectivity during hypnosis between left and right DLPFC and ipsilateral insular cortex and contralateral supramarginal gyrus. Seeds displayed in red. (A) Left DLPFC, Group by condition interaction (upper panel): orange–yellow regions show significantly increased functional connectivity to left DLPFC during hypnosis relative to rest, for highs but not lows. The effect is not significant for memory relative to rest at the same threshold. Hypnosis versus rest within highs (lower panel): orange–yellow regions confirm significantly increased FC to left DLPFC during hypnosis relative to rest for highs alone. The effect is not significant for memory relative to rest at the same threshold. The two hypnosis conditions are not significantly different. Mean z scores extracted from significant left insula cluster are displayed across group and condition (right panel). (B) Right DLPFC, Hypnosis versus rest within highs: orange–yellow regions show significantly increased FC to right DLPFC during hypnosis relative to rest for highs alone. Also, regions in the paracingulate gyrus and left insula showed significantly greater connectivity with right DLPFC in highs relative to lows. (C) Hypnotic response scores correlating with FC: orange–yellow regions (insular cortex and supramarginal gyrus) show increased FC to left DLPFC during hypnosis. For PCC and dACC seeds, no regions in the group by condition comparison survived correction, so no further tests were performed.
Furthermore, Highs who felt the most hypnotized exhibited the greatest connectivity between the left DLPFC and left insula, and this connectivity increased during hypnosis relative to rest, consistent with prior work (Hoeft et al. 2012). Clusters in left insula, middle frontal gyrus and superior parietal lobule were significantly positively correlated with intensity of hypnosis ratings at P < 0.05, GRF corrected (Fig. 3C, Table 3). No voxels from the ECN and the SN were significantly negatively correlated with hypnosis ratings.
Decoupling of the Executive Control and DMNs During Hypnosis
Using the same DLPFC seed regions, we also found that connectivity between left DLPFC and core default mode regions, including PCC and contralateral inferior parietal lobule (IPL), were significantly negatively correlated with hypnotic experience ratings among all 36 highs during both hypnotic scans at P < 0.05, GRF corrected (Fig. 4A, Table 3). The same held true between right DLPFC and DMN regions (Fig. 4B). Therefore as subjects reported they felt more hypnotized, the DMN became increasingly decoupled from both the left and right DLPFC, but only during hypnosis; connectivity between DLPFC and DMN was not significantly anti-correlated during the rest and memory control conditions.
Intensity of hypnosis covaries inversely with DLPFC-DMN connectivity: seeds displayed in red. (A and B) Connectivity during the two hypnotic states (averaged across happy/vacation) covaried with mean intensity of hypnosis ratings for 36 highs: regions in blue exhibit decreased FC with left (A) and right (B) DLPFC among subjects who felt more hypnotized. Scatterplots show individual mean z scores extracted from significant PCC clusters against individual mean hypnotic experience ratings.
Discussion
We identified three brain regions whose activity and functional connectivity change during hypnosis, consistent with our a priori hypotheses. The findings were evident in the two hypnosis conditions among high but not low hypnotizables, and they were different from the memory and rest conditions. Each of the major findings was also associated with the intensity of hypnotic experience reported among highs. The hypnotic state among highs was characterized by decreased low-frequency amplitude in the dACC. The dACC is a central node in the SN and has been shown to be critical for attentional control, specifically context evaluation, such as anxiety about what we should attend to and what we can ignore (Raz et al. 2002; Melcher and Gruber 2009). This reduction in dACC activity occurred during hypnosis compared to rest conditions only among high hypnotizables. Highs displayed higher dACC amplitude at rest than lows, and significantly lower dACC activity in both hypnosis conditions with respect to rest. Correspondingly, they showed no interaction with rest during the memory task. Furthermore, the decrease in dACC activity was linearly correlated with the intensity of feeling hypnotized while in the scanner. This finding indicates a selective reduction in dACC regional activity during hypnosis (Melcher and Gruber 2009; Zhang and Li 2012). Even outside of hypnosis, high hypnotizables have been found to involve the ACC as well as the intraparietal sulcus while performing a modified flanker attention task compared to lows (Cojan et al. 2015), although hypnotized highs have been shown to activate the ACC more in response to a Stroop conflict task than lows (Egner et al. 2005). In our data, highs displayed less regional amplitude in dACC and therefore less vigilance about possible alternative foci of attention during hypnosis than during a memory task, and less during memory than when subjects were at rest. This finding is consistent with previous observations that hypnosis invokes a suspension of critical judgment and ability to immerse oneself in a task while reducing awareness of alternatives (Tellegen and Atkinson 1974). Furthermore, ACC stimulation is associated with a “will to persevere” through difficulties (Parvizi et al. 2013), so its reduced activity could decrease personal agency and contribute to heightened suggestibility as well as the ability to dissociate from distress and pain that are characteristic of hypnosis (Spiegel H and Spiegel D 2004; Elkins et al. 2015).
The second finding is that functional connectivity between the executive control and the insular portion of the SN was altered from rest to hypnosis. Highs displayed increased connectivity between bilateral DLPFC and the ipsilateral insula during hypnosis compared to rest, while lows exhibited no differences among any states. In particular the degree to which highs exhibited this pattern correlated with hypnosis intensity ratings. Thus, subjects who were able to become most intensely hypnotized displayed higher connectivity between DLPFC and insula during hypnosis than rest. As levels of connectivity between these nodes during hypnosis was the same between groups (Fig. 3), these findings may reflect decreased cross-network connectivity at rest, a trait difference, which normalizes after engagement with task. Here, the greater ability of highly hypnotizable subjects to “switch” connectivity patterns from rest to other tasks is notable. This finding would seem inconsistent with the observation of (Hoeft et al. 2012) that higher hypnotizability is associated with greater functional connectivity between the left DLPFC and the dACC, and with work indicating higher prefrontal activity associated with hypnosis (Bell et al. 2011). However, while both insula and dACC are components of the SN, they subserve different functions, with insula more related to internal somatic function and monitoring task performance (Eckert et al. 2009; Menon and Uddin 2010; Cai et al. 2014), while the dACC is involved more with mood (Etkin et al. 2011) and external attention (Raz et al. 2002; Petersen and Posner 2012).
The increase in functional connectivity in highs during hypnosis between the DLPFC and the insula is also of interest because the insula is involved in the processing of body control and experience, emotion, empathy, and time through its extensive connections to cortical and subcortical limbic structures (Menon and Uddin 2010; Cai et al. 2014). Related to its role in somatic assessment, the insular cortex is also involved in spatial and temporal aspects of pain processing (Roder et al. 2007), as well as empathic perception of pain in others, (Menon and Uddin 2010; Gu et al. 2012) which clarifies the potency of hypnosis in pain control (Rainville et al. 1997; Melcher and Gruber 2009). Sham mobile phone radiation in electrosensitive subjects caused somatic symptoms that were mediated through increased insular activity (Landgrebe et al. 2008), similar to the ability of hypnosis to affect somatic perception and control. Thus these findings are consistent with the insula's role in brain regulation of somatic symptoms (Avery et al. 2014). Insular cortex is also involved in self-reflection, self-monitoring, and self-regulation (Herwig et al. 2012), which are all thought processes that can be altered in hypnosis and in related dissociative states involving alterations in identity, memory, and consciousness (Spiegel H and Spiegel D 2004; Bhuvaneswar and Spiegel 2013). The relatively low connectivity between DLPFC and insula in highs at rest (Fig. 3) may be related to the dissociation of aspects of somatic experience typical in hypnosis (Spiegel H and Spiegel D 2004; Bell et al. 2011) and dissociative traumatic experiences (Spiegel H and Spiegel 2004; Lanius et al. 2012; Bhuvaneswar and Spiegel 2013). Increased connectivity between the insular cortex and DLPFC in hypnosis may reflect heightened ability to engage in tasks with reduced anxiety about possible alternatives. This is also consistent with reduced dACC fALFF activity, which is compatible with the observed ability of those in hypnosis to become intensely absorbed (Tellegen and Atkinson 1974; Elkins et al. 2015) and have altered somatic perception and function (Klein and Spiegel 1989; Spiegel H and Spiegel D 2004).
In the memory state, dACC activity decreased and DLPFC-insula connectivity increased above resting levels but below that observed during hypnosis. The memory condition had been included as a control for the memory-intensive aspects of the hypnotic instructions; however, it appears instead to more closely align with network changes associated with the hypnotic state. It is possible that for highs, any focused task, explicitly hypnotic or not, might induce network changes similar to, if not as pronounced, as in hypnosis, as has been observed clinically (Tellegen and Atkinson 1974; Spiegel H and Spiegel D 2004).
Our third finding is the uncoupling of connectivity between the ECN and the DMN during hypnosis. This is contrary to what was hypothesized and what others have found (McGeown et al. 2009). We found that connectivity within the DMN was not affected by hypnosis. Rather, he subjects who reported they felt the most intensely hypnotized during the hypnotic scan conditions displayed the least coupling between bilateral DLPFC (ECN) and the PCC, contralateral IPL, and mPFC components of the DMN. In particular, reduced connectivity between left DLPFC and PCC was notable during hypnosis in highs but not during memory, and it was the clearest state difference highlighting hypnosis. These DMN regions are involved in self-referential processing and episodic memory (Greicius and Menon 2004), while the ECN is involved in cognitive control (Seeley et al. 2007), and the two networks become anti-correlated during working memory tasks (Leech et al. 2011). Dissociation between ECN and DMN in response to hypnotic induction likely reflects engagement in the hypnotic state and associated detachment from internal mental processes such as mind wandering and self-reflection. This reinforces the idea of hypnosis as a different state of consciousness, rather than a reduced level of arousal. This finding is related to but distinct from the recent report by (McGeown et al. 2015) that reports of hypnotic depth were associated with decreased functional connectivity within the anterior portion of the DMN, also suggesting reduced self-awareness.
Taken together, our findings indicate that cross-network co-activation patterns are modulated by hypnosis. Decreased fALFF in the dACC may reflect reduced context comparison and decreased attention to the external environment, while at the same time connectivity between the DLFPC and the insula is up-regulated, which facilitates somatic surveillance. Further, the decoupling of the DLPFC from the DMN during hypnosis reveals another neural mechanism underlying hypnotic absorption and, potentially, hypnotic loss of self-consciousness and amnesia (Kihlstrom 2013). Disengagement between frontal attentional regions and striatum-based procedural regions under hypnosis has been showed to improve procedural learning (Nemeth et al. 2013). Thus, effects of hypnosis may be due to separation of certain brain functions (ECN from DMN) as well as integration of others (ECN and SN). Increases in ECN–SN connectivity involving primarily DLPFC and ipsilateral insula occurred during hypnosis among high hypnotizables, who were at lower functional connectivity levels at baseline. In sum, the naturally occurring and clinically useful hypnotic state appears to be a product of reduced contextual vigilance (dACC activity) and disconnection from default mode resting activity, as well as enhanced coordination of networks engaged in task management and somatic surveillance.
Supplementary Material
Supplementary material can be found at: http://www.cercor.oxfordjournals.org/
Funding
This study was supported by grant # RCI AT0005733 from the National Center for Complementary and Integrative Health (PI, David Spiegel, M.D.), P41-EB015891 from the National Institute of Biomedical imaging and Bioengineering (PI, Gary Glover, Ph.D.), the Randolph H. Chase, M.D. Fund II, the Jay and Rose Phillips Family Foundation, and the Nissan Research Center. Data from this study were presented as a poster entitled “Brain Activity and Connectivity Underlying Hypnosis” at the annual meeting of the American College of Neuropsychopharmacology in Phoenix, AZ on December 10, 2014. Drs Jiang, White, Greicius, Waelde, and Spiegel report no biomedical financial interests or potential conflicts of interest.
Notes
All authors conceived and designed the study. D.S., M.W. and L.W. recruited and tested subjects. H.J., M.G., and M.W. administered fMRI scans. H.J. and M.G. analyzed fMRI data. H.J., M.G., M.W., L.W., and D.S. wrote the manuscript. All authors were involved in data acquisition, data analysis, and interpretation. Caroline Levin managed subject acquisition and participation. Maria Molfino helped in designing and recording condition instructions. Eric Neri conducted analysis of subject recruitment, screening, and hypnotizability. Gary Glover, Ph.D., provided invaluable consultation regarding fMRI methods and analysis. Conflict of Interest: None declared.
References