


Abstract
Selection on individuals that incorporate risk to quickly and accurately make a priori navigational assessments may lead to increased spatial ability. Jumping spiders (Araneae: Salticidae) are characterized by their highly acute vision, which mediates many behaviors, including prey capture and navigation. When moving to a specific goal (prey, nest, a potential mate, etc.), salticids rely on visual cues and spatial memory to orient in 3-dimensional space. Salticid spatial ability has been studied in homing and detour tasks, with Portia being considered one of the most skillful genera in terms of spatial ability in the family. Commonly living in complex environments, salticids are likely to encounter a wide variety of routes that could lead to a goal, and, as selection favors individuals that can accurately make assessments, they may be able to assess alternative route distances to select the most efficient route. Here, we tested whether 2 salticid species (Portia fimbriata and Trite planiceps) can discriminate and assess between different available routes by their length, and riskiness to escape from a stressful scenario. Results suggest that while Portia is more likely to choose the easiest and shortest escape routes, Trite is faster in both decision making about which route to take, and to escape. However, some individuals were able to use novel shortcuts instead of the routes expected, with Portia containing a higher proportion of shortcut-takers than Trite. These differences in spatial ability seem to correspond with the environmental complexity inhabited by each species.
INTRODUCTION
Assessment is the process by which animals evaluate perceived stimuli, converting them to an informational state to determine a specific level of risk or benefit (Blumstein and Bouskila 1996), while decision making is a cognitive process that allows animals to evaluate their environment, so they can avoid less favorable situations. Thus, decision making follows assessment and precedes observable behavior (Blumstein and Bouskila 1996). Because of increased ability to take the most efficient route to a goal, selection favors those individuals that can more quickly and accurately make assessments (Helfman 1989; Lima and Bednekoff 1999; Mirza and Chivers 2001; Brown 2003; Golub and Brown 2003). For example, in a food gathering task, selection of inefficient routes results in prolonged foraging, higher energetic cost, decreased time spent on other activities, and increased predation risk (Gibson et al. 2007).
Efficient route use has been observed in bees that integrate information about flight path vectors (“path integration”) to navigate to the colony or a food source (Cartwright and Collett 1983), allowing them to make novel shortcuts, even if they cannot see the goal (Dyer 1991; Menzel et al. 2005, 2011). Similarly, shortcuts have been observed in desert ants (Wehner and Wehner 1990) and wandering spiders (Seyfarth et al. 1982). In these cases, proprioceptive mechanisms are used, and the distance assessment of the alternative routes is only done after experience. Here, we investigate whether invertebrates with no previous experience can assess different routes beforehand and follow the most efficient route to reach a goal, without the use of path integration.
Animals that pounce on their prey, such as jumping spiders (Salticidae), are ideal subjects to investigate decision making. Salticids have a highly developed visual system (Land et al. 2012) and perform precision jumps for predation and locomotion, accurately assessing the distance to the landing point (Nabawy et al. 2018). Furthermore, when a salticid identifies a prey, it is sometimes forced to take a detour, as the direct route is either inaccessible (Tarsitano and Jackson 1997), or disadvantageous (Jackson and Wilcox 1993; Jackson and Pollard 1996). Salticid detours are preceded by scanning behavior which is characterized by a systematic movement of the body in order to visually inspect its surroundings (Tarsitano and Andrew 1999). Scanning is useful for visual inspection and route selection, but is also a crucial stage for navigation, as the individual potentially plans the route ahead of time (Cross and Jackson 2016). Previous detour-related tasks have shown that salticids can discriminate between routes that lead to a moving or nonmoving prey item from routes that do not (Tarsitano and Jackson 1992, 1994, 1997; Tarsitano and Andrew 1999; Tarsitano 2006), but work to date has not considered risk assessment in detour tasks.
Commonly living in complex environments, salticid ability to find the best route out of a vast number of alternative pathways could be crucial to save energy and time, and avoid predation. Therefore, salticids may be able to assess, beforehand, alternative routes to select the optimum route. While detouring is a spatial ability apparently widespread among the Salticidae, there is a particular genus that stands out due to its exceptional cognitive abilities and its behavioral flexibility (Jackson and Pollard 1996; Jackson and Cross 2011). Portia lives in complex rainforest habitats in which it preys upon spiders (Jackson and Wilcox 1990; Harland and Jackson 2000). To reach prey, Portia can perform complex detours spanning over a meter, while losing sight of its prey for more than 80 min (Jackson and Hallas 1986a; Jackson and Wilcox 1993). This suggests not only an outstanding sense of orientation in 3-dimensional space, but also spatial memory due to the spider’s need to move out of line-of-sight of the prey to follow the detour.
Here, our main objective was to determine if salticids can a priori assess route distance and riskiness, but our study differs from previous work in that there was no clear best goal (e.g., prey) which was reached by a single correct route; rather the goal itself was to choose the most efficient (or least risky) way out of a stressful situation. Our routes were also discontinuous, being made up of dowels, such that the problem may be conceived of as a series of subgoals which needed to be connected in advance in order to achieve the least risky outcome (escape) which was, in itself, identical for all routes. We first tested if salticids differentiate the distance between the dowels and choose a route representing the safest option. Second, we tested whether they can discriminate between different routes according to length, and choose the most suitable one in order to escape a stressful scenario. Additionally, we explored whether there are intraspecific and interspecific differences in route assessment. Being from a complex habitat (Jackson and Blest 1982), and known for its cognitive ability (Jackson and Pollard 1996; Jackson and Cross 2011), we predicted that Portia fimbriata would be more effective at making efficient route choices compared with a salticid from a less complex habitat and not known for exceptional cognitive ability, Trite planiceps. Our prediction is based on the clever foraging hypothesis, which postulates that individuals living in more complex environments have better neurobiological navigational abilities (Striedter 2005; Park and Bell 2010). As salticid performance improves with knowledge about the environment (Edwards and Jackson 1994; Aguilar-Arguello et.al 2018), we also predicted that adults would outperform subadults. Additionally, we predicted that females would outperform males, as they are typically the more motivated sex, at least in predation-based or learning tasks (Jackson and Wilcox 1990; Jackson and Pollard 1996; Jakob and Long 2016).
METHODS
Test animals and maintenance
Experiments were carried out from 0800 to 1300 h in the laboratory at the University of Canterbury. Trite planiceps Simon is a large (6–13 mm) salticid endemic to New Zealand and is typically found in coastal areas where it inhabits the rolled-up flax leaves of Phormium tenux and Cordyline spp. (Forster 1979). Trite planiceps were field collected in Christchurch, and were transferred to the laboratory, where they were housed individually in 1 L transparent plastic containers. Individuals were held in captivity for at least one week before testing. Spiders were fed once a week with 2 adult Musca domestica. Water supply was available through a cotton wick submerged in water which protruded into the container.
Portia fimbriata Doleschall is a large (6–11 mm) salticid from the rainforests of Northern Australia (Jackson and Hallas, 1986a). Portia fimbriata were lab-reared and, being predominantly araneophagic (spider-eating), were fed a combination of Musca domestica and a Badumna longinqua spider once a week. Individuals were housed as above.
Test arena
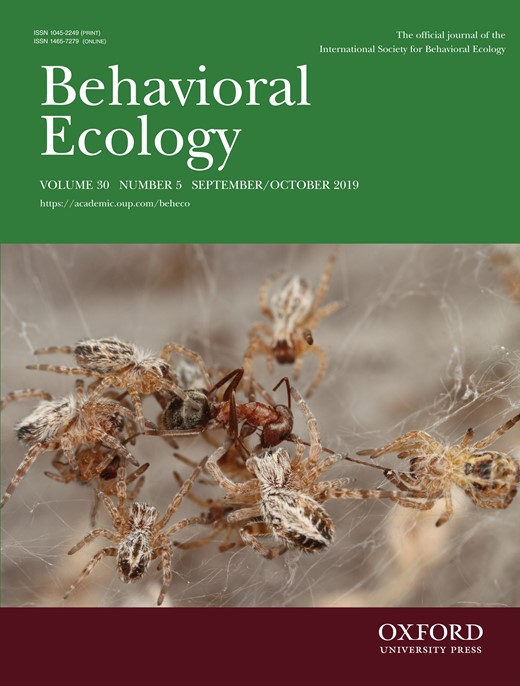
Salticid aversion to water is frequently used as a motivational tool in detour experiments (Cross and Jackson 2016). Here our aim was for spiders to choose a route to escape the stressful scenario of being surrounded by water by getting to the platform edge, rather than choosing a route to a specific target goal, such as prey. Our trials were performed in a 43 × 43 × 7 cm plastic container (pool) filled with water to a depth of 6 cm. From a central starting platform (PVC dowel, 9 cm high × 3.5 cm diameter), 4 possible escape routes extended to each of the 4 sides of the pool. Escape routes consisted of a series of PVC dowels (7 cm high × 1 cm diameter) protruding 1 cm from the water. These led to identical high-resolution pictures of foliage which surrounded the pool to both motivate the spiders to exit the pool and to provide visual obstruction of external visual stimuli. To account for directional biases, we rotated the pool to face North, South, West, or East at every trial. Rotations were randomized in blocks, each containing the 4 directions assigned in random order. To begin each trial, we gently placed a spider on the starting platform with a paintbrush. Spiders always rotated to observe their surroundings for between 50 to 220 s (first and third quartile) before choosing an escape route.
Each trial lasted up to 60 min, except if a spider was still on a route at this time, in which case we continued the trial until the spider reached the edge (maximum time: 110 min). If 60 min elapsed without the spider leaving the starting platform, the trial was aborted and the spider was retested (up to 4 times/day). In the rare cases in which the spider jumped into the water or missed a safe landing, we relocated it with a paintbrush to the dowel from which it had jumped. Relocation was only allowed twice during each trial; otherwise, the individual was tested at a later date.
All trials were recorded with a webcam (Logitech C920 HD Pro) placed over the arena. The variables scored from video were route duration (time from leaving the platform to reaching an edge by using a route), the chosen route, the number of dowels used to reach the edge of the pool (as sometimes the spiders skipped dowels by jumping over the top of one), latency (elapsed time from the start of the trial to the beginning of scanning), and scanning duration (elapsed time from start of visual scanning to jumping off the starting platform). All analyses were done using R version 3.3.3 (R Core Team 2018).
Experiment 1
Our objective was to determine if salticids are able to discriminate a “safe” route from 3 identical but more difficult “risky” routes, and if performance at this task differs depending on species and spider age and sex category (see Supplementary Methods 1.1). Based on typical salticid jumps being between 1 and 3 cm, the risky routes consisted of 4 dowels separated by 3.5 cm (center to center), while the fourth, safe route, was the same length but contained 8 dowels separated by 1.75 cm, which is close enough for spiders to carefully walk across without jumping (Figure 1A). We tested 47 Trite (15 males, 18 females, and 14 subadults) and 62 Portia individuals (16 males, 19 females, and 27 subadults) and only analyzed data from completed routes (see Supplementary Methods 1; Supplementary Figures S1 and S2).
Test arenas for (A) Experiment 1; 1 safe versus 3 identical risky escape routes (dowel separation denotes risk level), and (B) Experiment 2; easy versus increasingly long routes. See Methods for further details.
To ensure that the position of the dowels was placed at distances that spiders were able to differentiate, we recorded the number of dowels used when the spiders were escaping from the pool. Apart from the probability to choose a specific route, the proportion of dowels used during escape is important because there may be specific differences in jump length. These could alter the perceived difficulty of the routes, under 3 scenarios: 1) If the maximum separation between dowels in the risky routes is too small, we should expect no difference in route choice and also a low proportion of dowels used in both route types. In other words, the risky routes would be as easy as the safe route, the spiders would frequently skip dowels, and routes would be chosen randomly. 2) If the separation distance between dowels in the risky route is too large, we should expect no escapes through risky routes that are too difficult, and the use of the safe route should be the only outcome. Moreover, while using the safe route, spiders would also use a high proportion of dowels. 3) Risky routes are more difficult than safe routes, but still doable. The ideal scenario is providing doable routes, but with different levels of difficulty, so the spiders will be able to identify the safe route from the risky route and then make decisions about which one to take. In this case, the number of safe choices should be higher than random and the proportion of used dowels should be similar and high for both route types.
To investigate if route choice affected whether spiders skipped dowels, we compared the proportion of dowels used with respect to the total number of dowels in the chosen route. For this, we used a generalized linear model (GLM) with a binomial distribution and an additional dispersion parameter (family = quasibinomial) to account for over-dispersion. The proportion of dowels used was the response variable, with species, spider category (male, female, or subadult), the chosen route (safe or risky), and pool direction as the explanatory variables. The model accounted for all second-order interactions, but not for third-order interactions.
To determine if the spiders had a preference to choose the safe route, we used a GLM with a binomial distribution. Here, choice type (1 = safe route, 0 = risky route) was the binary response variable, while species and spider categories were the explanatory variables, accounting for second-order interactions. Given the estimated parameters, we calculated the confidence intervals (CI) of the observed choice type proportions for each species:spider category combination. Whenever the lower limit of the CI was greater than the 0.25 proportion of random choice, we interpreted the spiders of such a group as significantly choosing the safe route more often than by chance at a confidence level of 95%. In the case of specific comparisons of subcategories within each explanatory variable, we used Wald tests or contrasts tests with the “gmodels” package (Warnes et al. 2015); 95% CI were calculated for all estimated parameters.
Survival analyses, using Accelerated Failure Time models (AFT), were applied to scanning duration and route duration variables (Fox 2001). To select the best model, we used the Akaike Information Criterion (AIC; Crawley 2007).
Experiment 2
Our purpose was to determine if salticids can differentiate between different escape routes depending on their length, and if performance at this task differs depending on species and sex/age category. For these tests, methods were as described in Experiment 1, except for the configuration of the pool arena (Figure 1B). Here, spiders had to choose 1 of 4 different routes varying in length and number of dowels, with a straight route (4 dowels; maximum of 5 jumps to reach the pool edge), a zig-zag route (5 dowels; 6 jumps), a diagonal route (6 dowels; 7 jumps), and a curved route (7 dowels; 8 jumps). All dowels within all routes were separated by 3.5 cm. As a consequence, the energetically less expensive and shortest route was the straight route. We tested 42 Trite (11 males, 15 females, and 16 subadults), and 58 Portia (14 males, 19 females, and 25 subadults). Thirty-one of these 58 Portia had been used in Experiment 1, while a similar proportion of Trite (23 of 42) were used in Experiment 1.
Recorded variables were as in Experiment 1, with some additions, as spiders did not always use all dowels of the chosen route to escape. Skipping dowels on the chosen route meant less jumps than expected for that route and a shorter or potentially easier route for the spiders, contrary to the objective of the experiment, as a spider skipping dowels (i.e., taking a shortcut) could potentially find a relatively easy way to escape even if it chose the longer route. To account for this behavior, we calculated the number of dowels used by the spider divided by the number of dowels within the chosen route, with 1 meaning that the spider used all the available dowels in the escape route. We then included a binomial variable named “shortcut-taking” to separate spiders that took shortcuts (≦ 0.75; labeled as 1), from spiders that did not (>0.75, labeled as 0). The threshold was set at 0.75 because taking shortcuts in the 6- and 7-dowel routes was almost unavoidable, as the last dowels were only 1 cm from the pool’s edge and the spiders seldom used these dowels to reach the edge.
Shortcut-taking by the spiders to escape the arena was unexpected and exposed a potential flaw in our experimental design, as route preferences could be biased by spiders that took shortcuts. As a consequence, we performed 2 analyses; the first considering all data, and the second considering only data from nonshortcut-taking spiders. Analyzing both datasets separately not only assessed the behavior of all spiders and nonshortcut-taking spiders, but also allowed us to compare both datasets and make inferences about the effect of the explanatory variables among spiders that took shortcuts.
To test if there was a preference for a specific route depending on different response variables, we used 2 ordinal logistic regressions: for all data and for nonshortcut-taking spiders only. The chosen route was then parameterized as a 4-level ordered categorical response term (according to increasing number of dowels) in a cumulative link (or proportional odds) model (CLM, package: ordinal, Christensen 2018), with the terms spider category, species, and bout duration. Second-order interactions among the explanatory variables were not accounted for, as the AIC value was higher than the selected model. Wald and Likelihood test values were calculated for both CLM models. To make inferences about route preferences for Portia and Trite, we estimated the cumulative probabilities (P) to choose the different routes ordered by length at the intercept (when route duration is equal 0), and their CI at 95% (see Supplementary Methods 2). Thus, a preference to choose the 4-dowel route would be shown if P for 4-dowel route was >0.25. A preference for the 5- and 4-dowel route over the 6- and 7-dowel routes would exist if P > 0.5, and a preference for using the 6-dowel route or shorter over the 7-dowel route would be shown when P > 0.75.
Selection of the CLM including all data was the one with the lowest AIC value when checked for model diagnostics (see Christensen 2015). For comparative purposes, we used the same structure to analyze data from nonshortcut-taking spiders, so model selection was not used in this case. This model had the chosen route as the response variable, with spider category, species, and bout duration as explanatory variables, without interactions.
For both datasets, we analyzed scanning duration and route duration using AFT survival models and we selected the distribution type based on the lowest AIC. For the response variable scanning duration, species, chosen route, and shortcut-taking were the explanatory variables. Second-order interactions among the explanatory variables were not accounted for, as the AIC value was higher than the selected model. For the response variable route duration, species and chosen route were the explanatory variables.
To compare the number of shortcut-taking spiders versus nonshortcut-taking spiders, we used Chi-square tests of independence. The CLM was discarded as an option to analyze route choice, as the “ordinal” nature of this variable is lost and the route choice is biased. In other words, taking shortcuts allowed spiders to take any route and make it novel, invalidating route length and violating the assumptions of ordinal logistic regression (Christensen 2015). Therefore, inferences about route preference were obtained from comparisons of CLM’s belonging to general data and nonshortcut-taking spiders only. To compare the scanning duration and route duration among shortcut-taking spiders, we used nonparametric Kruskal–Wallis tests.
RESULTS
Experiment 1
Here, we tested if spiders were capable of discriminating a “safe” route from 3 “risky” routes, and if performance at this task differs depending on species and spider age and sex category. Overall, we found both species and age/sex differences on the routes taken, the probability to stay on a given route, and on the time spent scanning a route before embarking on it.
In our GLM analysis of whether route choice affected if spiders skipped dowels, we found that the proportions of dowels used did not differ between spider categories, either for the chosen route or cardinal direction (Supplementary Table S1). The proportion of dowels used in risky (min, max, median; 25–75% quartiles; 0.25, 1.0, 1.0; 0.75–1.0) and safe routes (0.125, 1.0, 0.813; 0.5–1.0) was high, but did not differ between safe and risky routes (P = 0.764; Supplementary Table S1). Additionally, Trite (0.5, 1.0, 1.0; 0.75–1.0) used a marginally nonsignificantly higher proportion of available dowels (P = 0.08; Supplementary Table S1) than Portia (0.125, 1.0, 0.75; 0.47–1.0). Overall, we found no significant interactions between explanatory variables (see Supplementary Table S1 for estimated effect sizes).
In Portia, the probability to choose risky routes was about 50% (Supplementary Figure S3), while Trite showed no preference for the safe route (Supplementary Figure S4). As a result, we were confident that the spatial task of Experiment 1 was challenging, but achievable, for both for salticid agility and cognitive ability. Portia females (estimate; CIs reported for all) (0.47; 0.26–0.69) chose the safe route more often than expected by chance, whereas subadults (0.41; 0.24–0.59) and males (0.31; 0.13–0.56) chose the safe route with similar frequencies as the rest of the routes (Supplementary Figure S3). Trite females (0.22; 0.07–0.44) and subadults (0.21; 0.06–0.47) exhibited random route choice, while males (0; no data-1) never selected the safe route (Supplementary Figure S4).
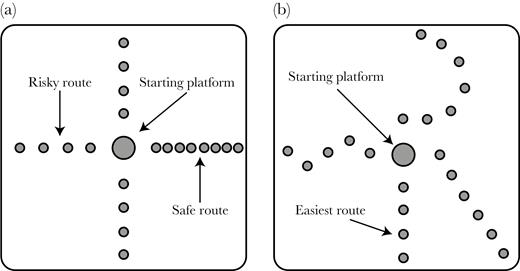
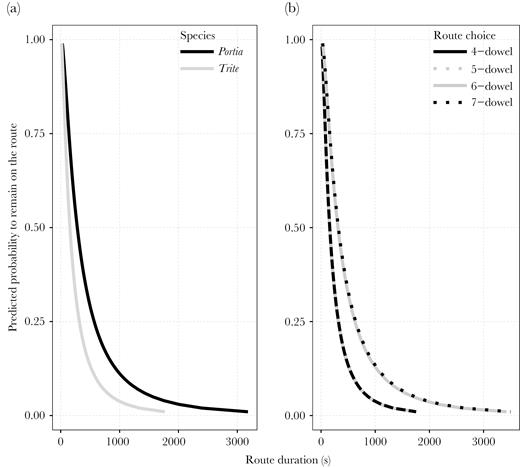
Our survival analyses examined time to event data to estimate the effects of covariates on acceleration/deceleration of the survival time (in this particular case, the time in which the spiders end a determined behavioral stage, influenced by an explanatory variable). Explanatory variables were: chosen route, species, and spider category. All second-order interactions were also accounted for in this model. Because salticid scanning is thought to be crucial for navigational planning (Cross and Jackson 2016), we analyzed the time spent scanning. Portia was equally likely to keep scanning over time, regardless of route chosen, although as time went on, the probability to remain scanning dropped (Figure 2). The latter effect was similar for Trite, but Trite’s probability to remain in scanning mode was higher when spiders opted to take the safe route compared with the risky routes (Figure 2). In other words, the probability to keep scanning during trials was significantly affected by the interaction of route choice and species, but not by route choice:category or category:species interactions (Table 1).
Summary table of AFT model with lognormal distribution: scanning duration as a function of route choice, spider category and species for Experiment 1, safe versus risky escape routes. Third-order interactions were excluded. CI = confidence interval at 95%
| Variable | Estimate | CI | Z | P |
|---|---|---|---|---|
| Intercept | 5.096 | 4.392–5.800 | 14.20 | <2e−16 |
| Route choice | −0.259 | −1.223–0.705 | −0.53 | 0.598 |
| Species (Trite) | −0.877 | −1.765–0.010 | −1.94 | 0.052 |
| Category (Subadult) | −0.244 | −1.112–0.624 | −0.55 | 0.581 |
| Category (Male) | −0.819 | −1.814–0.175 | −1.61 | 0.106 |
| Route choice: Trite | 1.999 | 0.771–3.227 | 3.19 | 0.001 |
| Route choice: Subadult | 0.052 | −1.102–1.206 | 0.09 | 0.929 |
| Route choice: Male | 0.325 | −1.259–1.911 | 0.40 | 0.687 |
| Subadult: Trite | 0.274 | −0.844–1.392 | 0.48 | 0.631 |
| Male: Trite | 0.757 | −0.525–2.040 | 1.16 | 0.247 |
| Log(scale) | 0.174 | Not applicable | 2.57 | 0.010 |
AFT model curves depicting the probability of continuing scanning behavior over time, as a factor of route chosen (risky or safe) in Experiment 1 for Portia and Trite spiders. Portia’s scanning behavior was not affected by route chosen, while Trite’s probability to remain in scanning mode was higher when spiders opted to take the safe route compared with the risky routes.
In terms of route duration, the AFT model was fitted to a lognormal distribution and chosen route:spider category, and species:spider category were the only interactions included. Spider category and species had a significant effect on the probability to remain on a chosen route. Specifically, Portia was more likely to stay en route than Trite (Supplementary Figure S5A), and females and subadults were more likely to stay on the chosen route than males (Supplementary Figure S5B). We found no significant interactions affecting route duration (Table 2).
Summary table of AFT model with lognormal distribution: route duration as a function of route choice, spider category and species for Experiment 1, safe versus risky escape routes. Third-order interactions and choice type: species interactions were excluded. CI = confidence interval at 95%
| Variable | Estimate | CI | Z | P |
|---|---|---|---|---|
| Intercept | 5.553 | 5.051–6.055 | 21.67 | <2e−16 |
| Route choice | −0.508 | −1.137–0.121 | −1.58 | 0.113 |
| Species (Trite) | −1.042 | −1.642–−0.441 | −3.40 | 0.0006 |
| Category (Subadult) | −0.458 | −1.110–0.193 | −1.38 | 0.168 |
| Category (Male) | −0.912 | −1.643–−0.180 | −2.44 | 0.014 |
| Route choice: Subadult | 0.181 | −0.682–1.044 | 0.41 | 0.680 |
| Route choice: Male | −0.547 | −1.687–0.592 | −0.94 | 0.346 |
| Subadult: Trite | 0.518 | −0.325–1.361 | 1.20 | 0.228 |
| Male: Trite | 0.557 | −0.365–1.479 | 1.18 | 0.236 |
| Log(scale) | −0.106 | Not applicable | −1.57 | 0.116 |
| Specific comparison | ||||
| Subadult vs. Male | 0.557 | 0.048–1.066 | 2.15 | 0.031 |
Experiment 2
Here, we tested if spiders were capable of discriminating between different escape routes depending on their length, and if performance differed depending on species and spider age/sex category. Overall, we found species differences on the routes taken, with Portia opting for shorter routes. There was no difference between species on the time spent scanning a route before embarking on it, but Portia was significantly more likely to create novel shortcuts by skipping dowels, and was significantly more likely to stay on its initially chosen route.
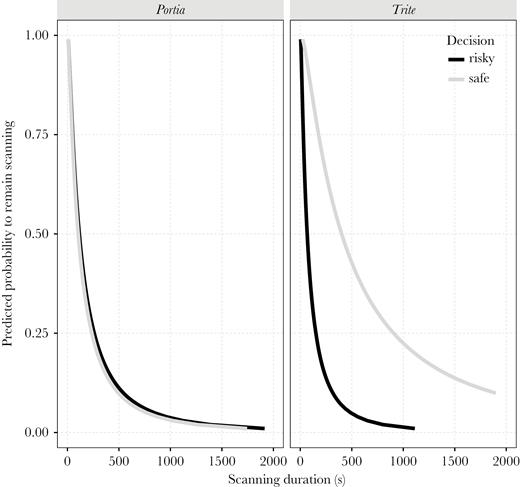
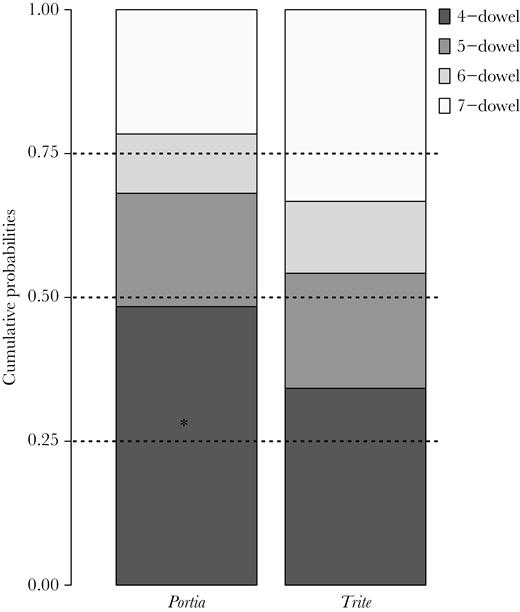
When all data (shortcut-taking and nonshortcut-taking spiders) were included (Table 3), the selected CLM was built with the “cloglog” link function. The probability of choosing a given route differed between species, with the odds of Portia choosing the 4-dowel route being 1.64 times that of Trite, which comparatively chose the longer routes. Spider category had no effect on the probability of choosing any given route, but route duration was related to the chosen route. In terms of odds ratios, a change of one unit (≡ 1 s) in route duration implies 0.07% increase in odds (0.7% for 10 s or 70% increase in odds for 1000 s) to choose the 5-, 6-, and 7-dowel routes instead of the 4-dowel route. This suggests that, when a spider took a long time to escape, it may have been simply because it chose a longer route instead of the 4-dowel route. In addition, Portia chose the 4-dowel route with a likelihood higher (P = 0.348) than the 0.25 expected by chance (CIs = 0.279, 0.425). The cumulative probability to choose either 4-, 5-, or 6-dowel routes was also lower than expected by chance in Portia (P = 0.688; CIs = 0.620, 0.749), meaning that the 7-dowel route was used more frequently than by chance. In the case of Trite, the cumulative probability to choose either the 4-, 5-, or 6-dowel route was lower than the 0.75 expected by chance (Figure 3), which indicates that Trite preferred the 7-dowel route over the rest of the routes (see Supplementary Table S2).
Results of ordinal logistic regression model (“cloglog” link) for routes varying in difficulty for all spiders (spiders that skipped dowels, or took shortcuts, and nonshortcut-taking spiders) in Experiment 2. CI = confidence interval at 95% (estimates and CI of estimates from Wald tests). NA = Not applicable.
| Variable | Estimates | CI of estimate | Z | P (Wald test) | P (likelihood ratio test) | Odds ratio | CI of odds ratio | ||
|---|---|---|---|---|---|---|---|---|---|
| 2.5% | 97.5% | 2.5% | 97.5% | ||||||
| Species | 0.495 | 0.001 | 0.988 | 1.967 | 0.049 | 0.046 | 1.64 | 1.0 | 2.7 |
| Category: subadult/female | −0.027 | −0.573 | 0.518 | −0.099 | 0.920 | 0.538* | NA | NA | |
| Category: male/female | −0.320 | −0.927 | 0.286 | −1.036 | 0.300 | ||||
| Route duration | 0.0007 | 0.0001 | 0.001 | 2.387 | 0.017 | 0.006 | 1.0007 | 1.0001 | 1.001 |
*The CLM likelihood ratio test estimates the effect of the spider category over the probability to choose each route chosen rather than compare pairs of subgroups (subadult vs. female, male vs. female) shown in the Wald test.
Cumulative probabilities for choosing routes by length calculated from the CLM considering all data set. Dotted lines depict the proportion of safe choices if spiders performed randomly (0.25 for 4-dowel, 0.5 for choosing either 4- or 5-dowel route, and 0.75 for choosing either 4-, 5-, or 6-dowel routes). *denotes the use of each route with a frequency higher than by chance.
Furthermore, with the combined shortcut-taking and nonshortcut-taking data, we found no effect of spider species, chosen route, nor their interaction, on the probability to remain in scanning mode (Table 4). However, species had a significant effect on the probability to remain on a chosen route (Table 5), with Portia being more likely to remain en route than Trite (Figure 4A). Route length also significantly affected the probability of the spiders to remain on their chosen escape route, with the shorter (4- and 5-dowel) routes not differing, and having a significantly lower probability for spiders to remain (in other words, a higher probability to escape sooner) than when choosing the longer, 6- and 7-dowel, routes (Table 5, Figure 4B).
AFT models fitted with loglogistic distribution for Experiment 2. The models include scanning duration as the response variable, whereas routes varying in length and spider species are considered as explanatory variables. The table shows AFT models results including all data (spiders that took shortcuts, and nonshortcut-taking spiders) and, below, for nonshortcut-taking spiders only. CI = confidence interval at 95%. NA = Not applicable.
| All data included | ||||
|---|---|---|---|---|
| Variable | Estimate | CI | Z | P |
| Intercept | 5.199 | 4.684–5.714 | 19.79 | <2e−16 |
| Route (5-dowel) | −0.527 | −1.294–0.239 | −1.35 | 0.18 |
| Route (6-dowel) | −0.287 | −1.060–0.484 | −0.73 | 0.47 |
| Route (7-dowel) | −0.398 | −1.236–0.440 | −0.93 | 0.35 |
| Species (Trite) | −0.504 | −1.377–0.367 | −1.13 | 0.26 |
| 5-dowel: Trite | 0.406 | −0.850–1.662 | 0.63 | 0.53 |
| 6-dowel: Trite | −0.343 | −1.668–0.981 | −0.51 | 0.61 |
| 7-dowel: Trite | −0.075 | −1.312–1.162 | −0.12 | 0.91 |
| Log(scale) | −0.434 | NA | −5.18 | 2.2e−07 |
| Data from nonshortcut-taking spiders only | ||||
| Intercept | 5.492 | 4.713–6.271 | 13.82 | <2e−16 |
| Route (5-dowel) | −0.075 | −1.341–1.189 | −0.12 | 0.906 |
| Route (6-dowel) | −0.561 | −2.137–1.014 | −0.70 | 0.485 |
| Route (7-dowel) | −0.546 | −1.911–0.819 | −0.78 | 0.433 |
| Species (Trite) | −0.473 | −1.620–0.674 | −0.81 | 0.419 |
| 5-dowel: Trite | −0.205 | −2.028–1.616 | −0.22 | 0.825 |
| 6-dowel: Trite | −0.382 | −2.687–1.921 | −0.33 | 0.745 |
| 7-dowel: Trite | NA | NA | NA | NA |
| Log(scale) | −0.302 | NA | −2.34 | 0.019 |
AFT models fitted with lognormal distribution for Experiment 2. The models include route duration as the response variable, whereas routes varying in length and spider species are considered as explanatory variables. The table shows AFT models results including all data (spiders that took shortcuts, and nonshortcut-taking spiders) and, below, for nonshortcut-taking spiders only. CI = confidence interval at 95%
| All data included | ||||
|---|---|---|---|---|
| Comparisons | Estimate | CI | Z | P |
| Portia/Trite | −0.633 | −1.031–−0.235 | −3.12 | 0.001 |
| 4-dowel/5-dowel | −0.005 | −0.531–0.519 | −0.02 | 0.982 |
| 4-dowel/6-dowel | 0.572 | 0.001–1.143 | 1.96 | 0.049 |
| 4-dowel/7-dowel | 0.779 | 0.261–1.296 | 2.95 | 0.003 |
| 5-dowel/6-dowel | 0.578 | −0.009–1.166 | 1.93 | 0.054 |
| 5-dowel/7-dowel | 0.784 | 0.247–1.322 | 2.86 | 0.004 |
| 6-dowel/7-dowel | 0.206 | −0.381–0.794 | 0.69 | 0.490 |
| Data from nonshortcut-taking spiders only | ||||
| Portia/Trite | −0.779 | −1.333–−0.224 | −2.75 | 0.005 |
| 4-dowel/5-dowel | 0.192 | −0.425–0.809 | 0.61 | 0.541 |
| 4-dowel/6-dowel | 0.898 | 0.108–1.688 | 2.23 | 0.025 |
| 4-dowel/7-dowel | 0.217 | −0.670–1.103 | 0.48 | 0.632 |
| 5-dowel/6-dowel | 0.706 | −0.148–1.560 | 1.62 | 0.103 |
| 5-dowel/7-dowel | 0.024 | −0.902–0.950 | 0.05 | 0.959 |
| 6-dowel/7-dowel | −0.682 | −1.767–0.403 | −1.23 | 0.218 |
AFT model curves for Experiment 2, depicting the probability of continuing on the route chosen over time for (A) all Portia and Trite spiders and (B) routes varying in length for both species combined (including data from spiders that skipped dowels, or took shortcuts, and those that did not). Portia was more likely to remain on a chosen route than Trite, and time on route for shorter routes were similar to each other and shorter than for the longer routes.
When comparing shortcut-takers (39 Portia and 18 Trite) against nonshortcut-takers, (19 Portia and 24 Trite) we found that Portia was significantly more likely to skip dowels than Trite (X2 = 5.91, P = 0.015; 67% vs. 43%, respectively), however, no sex/age category within Portia was more likely to take shortcuts (X22 = 0.262, P = 0.877; males: 71%, females: 63%, subadults: 68%). Within Trite, males (73%) were significantly more likely to take shortcuts than females (20%) or subadults (44%), although these are based on small sample sizes (X22 = 7.21, P = 0.027) (see Supplementary Figure S6 for sample sizes and trends).
We then partitioned the dataset to further explore trends within the shortcut-taking and nonshortcut-taking groups. The CLM for nonshortcut-taking spider dataset integrated the “cloglog” link function, showing no significant effect of species, spider category, or route duration on the probability to choose a specific route (Table 6). Nevertheless, Portia chose the 4-dowel route with a probability higher than the 0.25 expected by chance (P = 0.484; CIs = 0.364, 0.606; Figure 5), while Trite exhibited random route choices (see Supplementary Table S2). Similar to our results using the combined data (shortcut and nonshortcut-takers), we found that the probability of nonshortcut-taking spiders to remain scanning the chosen route was not affected by species, route chosen, nor their interaction (Table 4), that nonshortcut-taking Portia were more likely to remain on the chosen route than Trite (Supplementary Figure S7A), and that route length affected the probability of the spider remaining on that route (Supplementary Figure S7B; Table 5).
Results of ordinal logistic regression model (“cloglog” link) for spiders that took shortcuts in Experiment 2, for routes varying in length. CI = confidence interval at 95% (estimates and CI of estimates from Wald test). NA = Not applicable.
| Variable | Estimates | CI of estimate | Z | P (Wald test) | P (likelihood ratio test) | Odds ratio | CI of odds ratio | ||
|---|---|---|---|---|---|---|---|---|---|
| 2.5% | 97.5% | 2.5% | 97.5% | ||||||
| Species | 0.507 | −0.271 | 1.28 | 1.276 | 0.202 | 0.203 | 1.66 | 0.8 | 3.6 |
| Category: subadult/female | −0.242 | −1.009 | 0.524 | −0.620 | 0.536 | 0.440 | NA | NA | |
| Category: male/female | −0.724 | −1.815 | 0.366 | −1.302 | 0.193 | ||||
| Route duration | 0.0001 | −0.0005 | 0.0008 | 0.369 | 0.712 | 0.705 | 1.0001 | 0.8 | 3.6 |
*The CLM likelihood ratio test estimates the effect of the spider category over the probability to choose each route chosen rather than compare pairs of subgroups (subadult vs. female, male vs. female) shown in the Wald test.
Cumulative probabilities for choosing routes by length calculated from the CLM considering nonshortcut-taking spiders. Dotted lines depict the proportion of safe choices if spiders performed randomly (0.25 for 4-dowel, 0.5 for choosing either 4- or 5-dowel route, and 0.75 for choosing either 4-, 5-, or 6-dowel routes). *denotes the use of each route with a frequency higher than by chance.
Within the subset of spiders that took shortcuts, we found no effect of sex/age category on scanning duration (H2 = 3.367, P = 0.186) or route duration (H2 = 1.889, P = 0.389) in Portia (Supplementary Figure S8A). Within Trite, however, while we found no effect of sex/age category on scanning duration (H2 = 2.904, P = 0.234), we did find differences in route duration (H2 = 6.934, P = 0.031; Supplementary Figure S8B), which were driven by female variability in a very small sample (n = 3 female shortcut-taking Trite) based on a single slow female, so this should be taken with caution.
DISCUSSION
We demonstrate that salticids are able to assess distance in a spatial context by discriminating the difficulty of discontinuous routes. Furthermore, salticids can devise novel shortcuts or short route options to escape the testing arena. By preferring the safe escape route for Experiment 1, tending to take shortcuts more and preferring the shortest route when it did not take shortcuts in Experiment 2, it seems that Portia was either more inclined to make larger jumps or better at assessing spatial tasks than Trite.
The physical difficulty of our tests in terms of distance between dowels is unlikely to have been overly challenging for either species. All individuals were able to jump from 1 dowel to another and all were able to escape from the pool, even using the most difficult routes (i.e., risky and 7-dowel routes). Both species have the ability to jump several times the distances used here (Trite: up to 150 mm (Taylor and Jackson 1999); Portia: up to 80 mm (Jackson and Hallas 1986b). Interspecific differences are thus likely to be either due to differences in rearing conditions (Trite were field collected, while Portia were lab-reared), spatial or cognitive ability, motivation, or a combination of both of the latter, rather than inability to escape through a difficult route.
Previous detour-related tasks on salticids, including the species tested here, show that they discriminate between routes leading to a prey item from those that do not (Tarsitano and Jackson 1992, 1994, 1997; Tarsitano and Andrew 1999; Tarsitano 2006). Unlike in those studies, we did not restrict our testing solely to adult females and there was no clear best goal at the end of a single correct route. Instead, the goal was to choose the most efficient, or least risky, escape from a stressful situation. Additionally, the routes were discontinuous, leading to the problem being conceptualized as a series of subgoals or route attributes that had to be connected in advance to achieve the least risky outcome (escape) which was, in itself, identical for all routes. The location of a subgoal (or secondary objective) must therefore be stored in memory (Hill 1979), and, as the number of subgoals increases, more memory capacity is required. Thus, our tests should require more complex cognitive processing than continuous routes that lead or do not lead to a single salient outcome. Perhaps it is because of these differences that we found less clear-cut effects than previous studies (e.g., Tarsitano and Jackson 1992, 1994, 1997; Tarsitano and Andrew 1999; Tarsitano 2006).
While rearing salticids in a social environment (Leidtke and Schneider 2017) and with environmental enrichment (Carducci and Jakob 2000) makes them perform better in learning tasks, rearing condition does not seem to adequately explain our results. All spiders were housed with environmental enrichment, lab-reared spiders were reared socially for the first few instars of their life (Portia eat each other so this is not feasible for their entire life-span), and all tested spiders were naïve to the apparatus. Our experience in rearing salticids has typically been that after several generations within the lab, salticids perform more poorly. Our Portia were third-generation lab-reared, yet outperformed wild-caught Trite. Another possibility to explain our results is that salticids were able to count the number of dowels forming an escape route, and make decisions based on this. It is known that a related species to Portia fimbriata, P. africana, can classify up to 3 prey as discrete number categories (Nelson and Jackson 2012, Cross and Jackson 2017). It remains unclear whether failure of higher numerical ability is a cognitive or motivational limitation. While the possibility that our spiders were able to count dowels is tantalizing, it is impossible to determine whether route preference was driven by the number of dowels within the route. Nonverbal ability to discretely count objects (“subitize”) tends to break down above 4 (Gallistel and Gelman 2000; Dacke and Srinivasan 2008), which was the minimum number of dowels used in these tests. Thus, it is unlikely that our P. fimbriata could numerically distinguish between routes. Instead, these may have been assessed in terms of the “quantity” of the continuous variables created by having more dowels (i.e., surface area, volume, areas of contrast, etc.). Our results indicate that Portia is likely able to assess a route by its length, and by the distance between dowels, and may be better able at evaluating a path containing multiple subgoals (dowels) than Trite, which, in turn, may tend to assess only from 1 dowel to the next without searching for alternative subgoals, resulting in less incidence of taking shortcuts.
Portia was generally slower at escaping the pool arena, possibly because it adopts an unusually slow, choppy, gait when walking (Jackson and Blest 1982, Jackson and Hallas 1986b). Nevertheless, several strands of evidence suggest that our experiments posed problems more easily solved by Portia than Trite: in Experiment 1, Portia took safe routes above chance levels, yet scanning duration for this species was similar for both safe and risky routes. In contrast, Trite’s route choice was random, but when it did choose the safe route, prior to exiting the starting platform it scanned the route longer compared with risky routes and compared with Portia. In salticids, the duration of visual scanning is correlated with decision making and planning ahead of time (Tarsitano and Andrew 1999; Cross and Jackson 2016). This suggests either that Portia was more flexible and willing to take risks “on the fly,” or was faster at assessing its visual surroundings to make an “informed” risk-averse decision compared with Trite. Furthermore, in Experiment 2, when using the entire dataset, Portia was more likely than Trite to escape via shorter routes. Additionally, for spiders that took shortcuts, decision making in both species did not differ for the 5-, 6-, and 7-dowel routes, yet Portia preferred the 4-dowel route, while Trite showed no preference. Results of Experiment 1, in which Portia used a significantly lower proportion of dowels compared with Trite, corroborate findings of Experiment 2, in which Portia was significantly more likely to take shortcuts than Trite. This may suggest that Portia has better facility to “mentally” create shortcuts or assess easier routes than Trite (i.e., route planning, Cross and Jackson 2016). Our results are in line with a previous comparative detour task in which Portia exhibited better visual discrimination for nonmoving prey than Trite (Tarsitano and Jackson 1994). Interestingly, when comparing results from data containing both spiders that took and did not take shortcuts with those that did not take shortcuts only, we found that spiders of both species that took shortcuts exhibited a preference for the 7-dowel route. As the longest route, we expected the 7-dowel route to be the less preferred option. It is possible that the shape of the route may have provided a wider range of alternative routes for spiders due to the curved arrangement of the dowels. This meant that, in practice, skipping dowels on the longest route required a shorter jump than skipping dowels on the other routes. Coupled with this, the angle as the route neared the pool edge meant that the distance to the edge from the fifth and sixth dowels was short, making it relatively easy to jump to the edge from these 2 dowels, thus skipping the seventh dowel.
Due to psychophysical and behavioral evidence that females are better performers than males (Jackson and Hallas 1986b; Jackson and Pollard 1996; Zurek et al. 2010; Zurek and Nelson 2012; Jakob and Long 2016), we expected females to outperform males and subadults, and also that adults would outperform subadults, because experience seems to improve behavioral outcomes in salticids (Edwards and Jackson 1994; Skow and Jakob 2005; Hill 2006). Possibly because we used neither potential prey nor conspecifics (often used as motivators in salticid studies) in our tests, sex and age differences were not apparent in our cognitively demanding experimental set-up, other than males tended to complete routes faster—possibly because adult males may be more active due to their role in actively searching for mates at this life stage (Jackson and Pollard 1997). The other exception, that shortcut-taking females were marginally slower to escape than males and subadults, should be taken with caution, as this was based on a single female (from 3) that took a very long time.
Differences in spatial ability selected by characteristics of the environment have been observed in several taxa (Gauin and FitzGerald 1986; Costanzo et al. 2009; Schwarz and Cheng 2010; Clarin et al. 2013). For example, despite the fact that Melophorus sp. and M. bagoti are closely related species of desert ants, they rely on different navigation mechanisms: M. bagoti inhabits visually rich environments and depend mainly on visual landmarks for orientation, whereas Melophorus sp. lives in visually barren environments (Schwarz and Cheng 2010; Schultheiss et al. 2016) and primarily relies on path integration. Tarsitano and Andrew (1999) proposed that Portia’s spatial prowess may be selected for as a consequence of having to search for mates or prey in a complex environment containing large trees (Jackson and Blest 1982), as suggested by the clever foraging hypothesis (Striedter 2005; Park and Bell 2010). In the rainforest of Australia, Portia has numerous predators and considerable competition for prey (Jackson and Blest 1982). In contrast, in the temperate areas of New Zealand, where Trite is found, there is significantly lower competition for food, and predation is most likely limited to birds and a few invertebrates, including dragonflies and earwigs, 2 parasitoid wasps, and 3 species of spider (Taylor 1997; Taylor and Jackson 1999). It is tempting, but premature, to conclude that the simpler environment inhabited by Trite, consisting of flax bushes to a height of about 2.5 m (Taylor and Jackson 1999), could lead to different spatial ability than Portia. To adequately answer this question, we must assess whether salticids can plan entire routes before leaving a starting platform, rather than making adjustments en route. Our findings about willingness to take shortcuts suggest that further refinements are needed to address whether interspecific differences in shortcut-taking are either due to premeditated decisions, or to interspecific differences in inclination to improvise during the execution of a given trajectory.
Acknowledgments
We are grateful to Nicholas Etheridge for help with arena design and construction and to Aysnley Macnab for spider maintenance and field collection. We also thank Lauren Scott, Pariya Tork, and Carol Bedoya for help in the field. S.A.-A. was supported by a College of Science Scholarship from the University of Canterbury.
Data accessibility: Analyses reported in this article can be reproduced using the data provided by Aguilar-Argüello et al. (2019).
